


In today's digital age, there is plenty of raw data being generated every second from various sources such as social media, websites, sales transactions, etc. This massive amount of data can be overwhelming without proper management. That's where data analysis comes into play.
In this article, we will uncover the definition of data analysis, its benefits, the complete data analysis process, some real-world examples, and top data analysis tools that will help you get familiar with the field.
What is Data Analysis and Its Benefits?

Data analysis is examining, cleansing, transforming, and modeling data to discover useful information, inform conclusions, and support the decision-making process. It is a crucial aspect of any business as it helps in data-driven decisions based on facts and statistics rather than gut instincts.
Some of the key benefits of performing data analysis are:
- It helps organizations make better decisions by providing them with accurate and up-to-date information.
- Businesses can identify areas where they can streamline processes and reduce large tasks.
- It allows companies to understand their customer's needs and preferences, leading to more targeted marketing campaigns and improved customer satisfaction.
- Businesses can stay ahead of their competition by identifying trends and opportunities in the market.
- Organizations can identify cost-saving opportunities and eliminate unnecessary expenses.
- By analyzing customer feedback and market trends, companies can create products that better meet consumer demand.
- By analyzing historical data, businesses can better predict future trends and plan accordingly.
- With data analysis tools, organizations can monitor key performance indicators in real time and quickly respond to changes in the market.
- Data analysis allows businesses to compare their performance against industry benchmarks or competitors for continuous improvement.
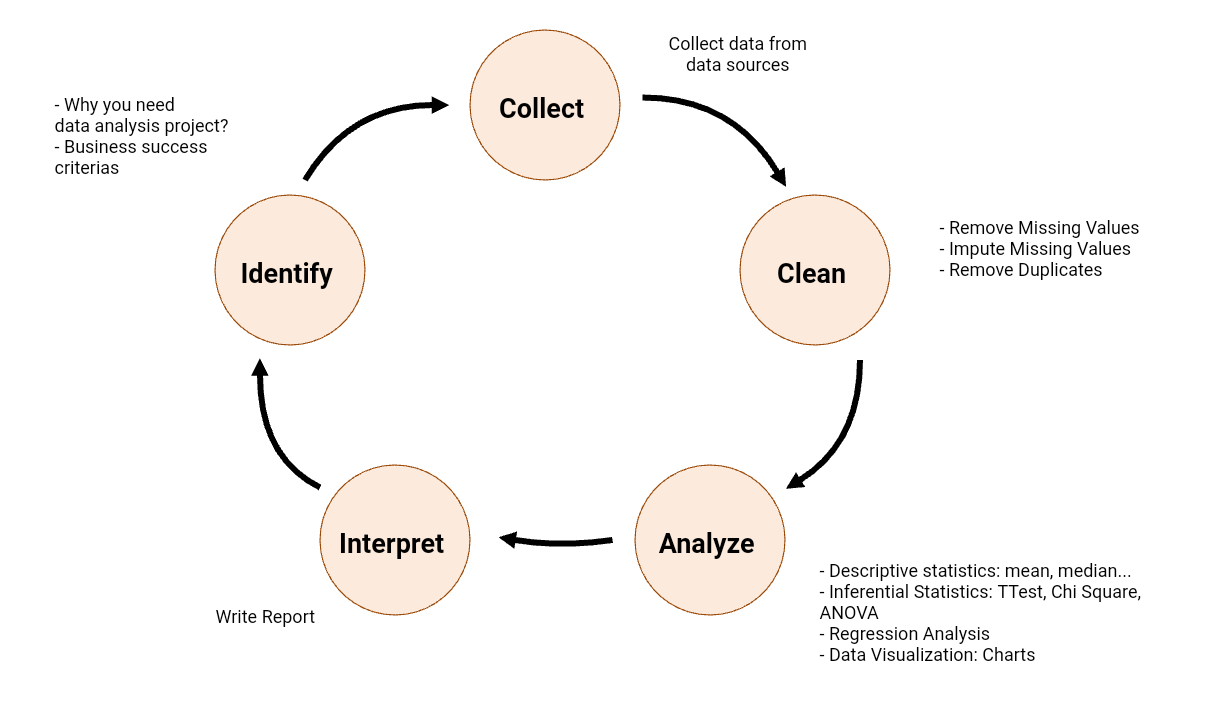
Data Analysis Process

There are five major steps in the data analysis process. Let us closely examine these steps one by one.
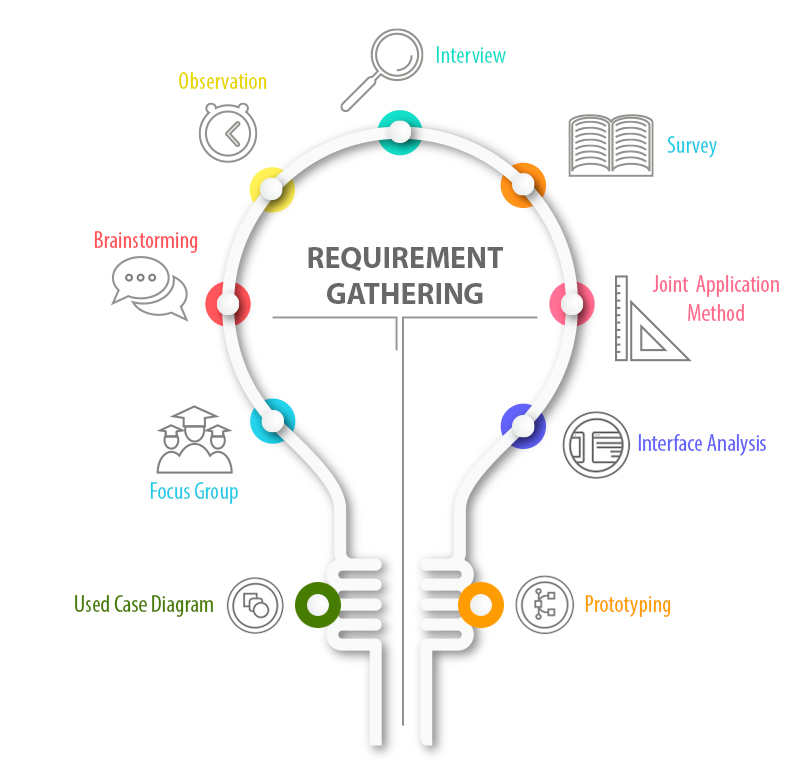
Step - 1: Gathering Requirements

The first step in data analysis involves defining the problem statement that needs to be addressed.
Before diving into the data analysis process, it is important to clearly understand what you are trying to achieve and what specific questions you need answers to. This step sets the foundation for further analysis.
To define your problem statement you should consider the following questions:
1. What is the goal of your analysis?
2. What specific metrics or key performance indicators (KPIs) will help you measure success?
3. What data sources do you have access to?
Once you have a clear understanding of your problem statement, you can start gathering and preparing the necessary data for analysis.
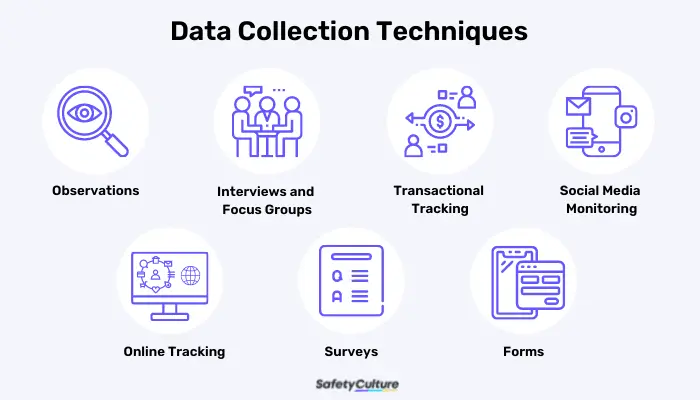
Step 2: Data Collection

Collecting data is the foundation of any successful data analysis project. Without accurate and relevant data, the analysis will be flawed and conclusions drawn from it may be misleading. There are several key steps involved in collecting data for analysis:
1. Identify the sources of data:
Once you have defined your research question, the next step is to identify the sources of data that will help you answer that question. Data can come from a variety of sources such as surveys, interviews, observations, existing databases, or online sources.
2. Determine the method of data collection:
Depending on the nature of your research question and available data sources you will need to determine the best method for collecting the data. This could involve conducting surveys, interviews, experiments, or using automated tools for web scraping or data extraction.
3. Develop a data collection plan:
A well-thought-out data collection plan should include details such as who will collect the data, when and where it will be collected, how it will be recorded and stored, and any ethical considerations.
4. Collect the data:
Once your plan is in place, it's time to start collecting the data. Be sure to follow your plan closely and record all information accurately. It's also important to keep track of any potential biases or errors that may arise during the collection process.
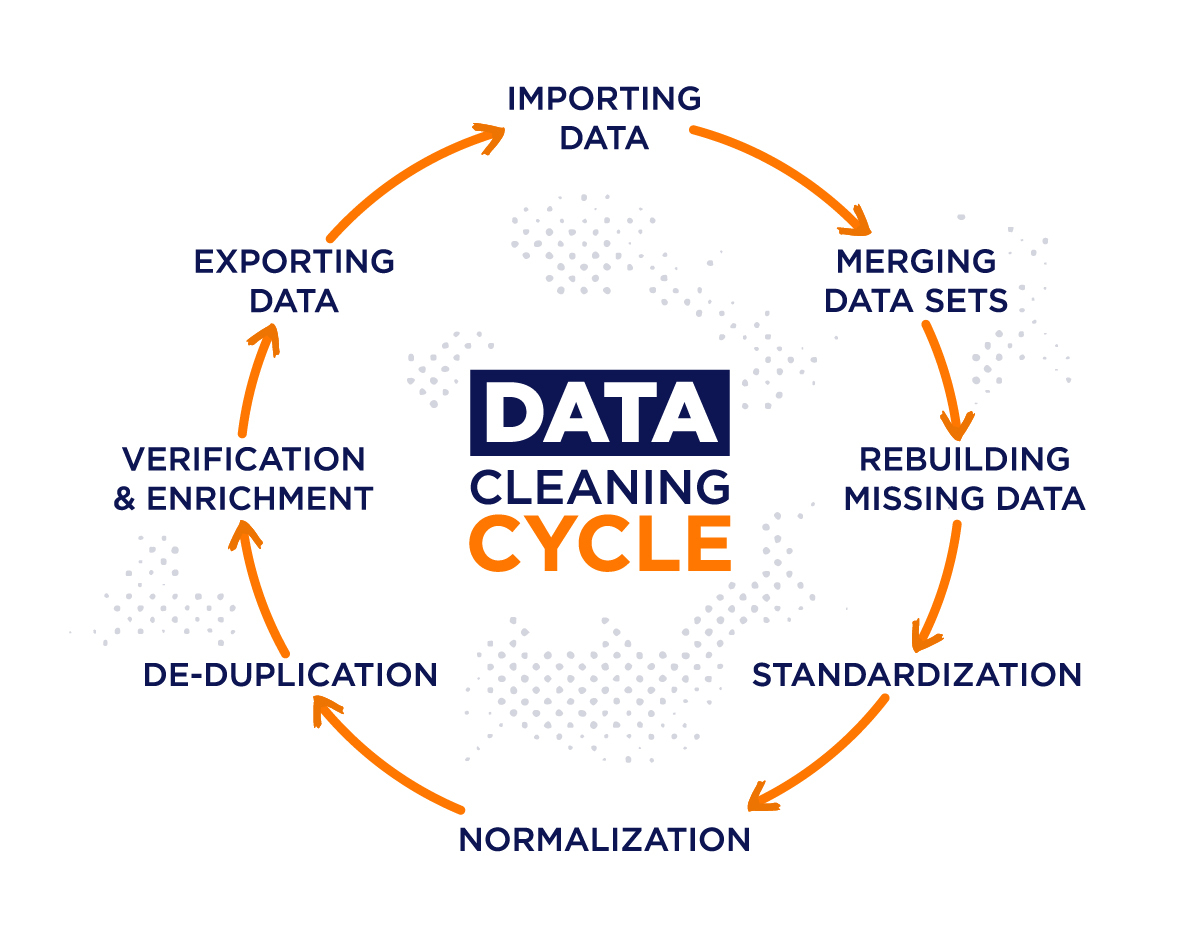
Step 3: Data Cleaning

Cleaning raw data involves identifying and correcting any inaccuracies, missing values, duplicates, or outliers in the dataset. This ensures that the analysis results are accurate and reliable. Here are some key steps involved in cleaning data:
1. Removing duplicates:
Duplicates can skew analysis results by increasing certain values or giving undue importance to certain observations. It is important to identify and remove duplicate entries from the dataset to avoid such biases.
2. Handling missing values:
Missing values can also affect the accuracy of analysis results. There are several ways to handle missing values, including imputation or removing rows with missing values altogether.
3. Standardizing data formats:
Data may be stored in different formats across different sources within a dataset. Standardizing these formats makes it easier to compare and analyze the data effectively.
4. Correcting errors:
Errors in data entry or recording can lead to inaccuracies in analysis results. It is important to identify and correct any errors in the dataset before proceeding with the analysis.
5. Removing outliers:
Outliers are extreme values that lie far outside the normal range of values in a dataset. While outliers may sometimes be valid observations, they can also skew analysis results significantly. It is important to identify and remove outliers appropriately.
6. Ensuring consistency:
Consistency in naming conventions, units of measurement, and other variables is crucial for accurate data analysis. Inconsistencies can lead to confusion and errors in interpretation.
Step 4: Analyze data

Data analysis is a crucial step in any research or business project. It helps to make sense of the raw data collected and draw meaningful insights from it. The fourth step in data analysis involves analyzing the data to uncover patterns, trends, and relationships within the dataset.
Several techniques can be used for analyzing data, depending on the type of data and the research question being addressed. Some common methods are mentioned below:
1. Descriptive Analysis
It is used to summarize and describe the main features of a dataset. This may include calculating measures such as mean, median, mode, standard deviation, and range. These statistics provide a basic understanding of the distribution of the data and help to identify any outliers or anomalies.
2. Inferential Analysis
It is used to make predictions about a population based on sample data. This includes hypothesis testing and confidence intervals. Inferential statistics allow researchers to draw conclusions about relationships between variables and make informed decisions based on the data.
3. Regression analysis
It is used to model the relationship between one or more independent variables and a dependent variable. This technique is particularly useful for predicting outcomes based on input variables. Regression analysis can also be used to identify important predictors within a dataset.
4. Cluster analysis
It is used to group similar objects based on their characteristics. This technique is commonly used in market segmentation or customer profiling. Cluster analysis helps to identify patterns within the data that may not be immediately apparent.
5. Factor analysis
It is used to reduce the dimensionality of a dataset by identifying underlying factors or latent variables that explain the observed correlations between variables. This technique can help to simplify complex datasets and identify key drivers of variation.
Step 5: Interpreting Data

Interpreting data involves making sense of the results obtained from the analysis process. This step requires careful consideration of the findings and determining what they mean about the research question.
There are several key aspects to consider when interpreting data:
1. Identifying patterns and trends:
Once you have a good grasp of the context, it’s time to look for patterns and trends in the data. This could involve identifying correlations between variables, spotting outliers, or noticing recurring themes in qualitative data.
2. Comparing results:
It can be helpful to compare your results with existing benchmarks to see how your findings stack up against industry standards. This can provide additional context and validation for your interpretations.
3. Concluding:
Based on your analysis and observations, conclude what the data is telling you. Be sure to support your conclusions with evidence from the data.
4. Communicating insights:
It’s important to effectively communicate your interpretations and insights to others. This could involve creating visualizations such as charts or graphs to illustrate key points, writing a report summarizing your findings, or presenting your results to stakeholders clearly and concisely.
Types of Data Analysis

There are different types of data analysis techniques including
- Descriptive analysis focuses on summarizing the main characteristics of a dataset.
- Diagnostic analysis aims to identify the causes of certain outcomes or events.
- Predictive analysis uses historical data to predict future trends or behaviors.
- Prescriptive analysis provides recommendations on how to achieve the desired outcome.
To get detailed information about types of data analysis, check out this article.
Real-world Examples of Data Analysis Process
1. Amazon Case Study
One of the key uses of data analysis is in marketing. Companies can leverage customer data to understand consumer behavior, preferences, and buying patterns. For example, e-commerce giant Amazon uses data analysis to recommend products to customers based on their browsing history and purchase behavior. This personalized approach not only enhances the shopping experience for customers but also increases sales for the company.
2. IBM’s Watson Health Platform Case Study
Another real-life example of data analysis in action is in healthcare. Hospitals and healthcare providers utilize patient data to identify trends, predict disease outbreaks, and improve patient outcomes. For instance, IBM’s Watson Health platform analyzes medical records and clinical trials to provide doctors with treatment recommendations and assist in diagnosing illnesses more accurately.
3. Finance Sector Case Study
In the finance sector, banks use data analysis to detect fraudulent activities and assess credit risk. By analyzing transactional data in real-time, financial institutions can identify suspicious patterns and prevent potential fraud before it occurs.
Tools for Data Analysis Process
Data analysis tools allow users to collect, clean, analyze, and visualize data to gain valuable insights that can drive business growth and success.
There are many different types of data analysis tools available on the market today, each with its unique features and capabilities. Some of the most popular data analysis tools include:
1. Sprinkle Data

Sprinkle Data is a self-service business intelligence tool with advanced analytics capabilities specifically built for cloud data warehouses. With Sprinkle Data users can consolidate data from various sources transform it and use it to create reports with drag and drop option.
Click here to get started with the platform.
2. Microsoft Excel:

Excel is a widely used spreadsheet program that offers powerful data analysis capabilities, including pivot tables, charts, and formulas. It is a versatile tool that can be used for basic data analysis as well as more complex tasks.
3. Tableau:

Tableau is a data visualization tool that allows users to create interactive dashboards and reports using a drag-and-drop interface. It is known for its user-friendly design and ability to quickly generate insightful visualizations from large datasets.
4. Python:

Python is a programming language that is commonly used for data analysis and machine learning tasks. With libraries such as Pandas and NumPy, Python provides powerful tools for cleaning, analyzing, and manipulating large datasets.
5. R:
R is another programming language commonly used for statistical analysis and data visualization. It offers a wide range of packages for conducting advanced analyses such as regression modeling, time series forecasting, and clustering.
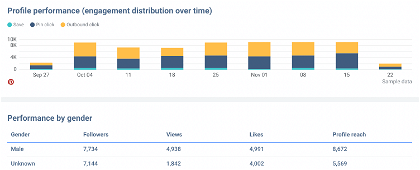
6. Google Analytics:

Google Analytics is a web analytics tool that allows users to track website traffic and user behavior. It provides valuable insights into how users interact with websites and helps businesses optimize their online presence.
Frequently Asked Questions FAQs - What is data analysis with examples
What are the 5 processes of data analysis?
The 5 processes of data analysis are data collection, data cleaning, data exploration, data analysis, and data interpretation.
What are the 7 steps of data analysis?
The 7 steps of data analysis include defining the problem, collecting relevant data, cleaning and organizing the data, exploring the data, analyzing the data using statistical methods, interpreting the results to conclude, and communicating findings through reports or presentations.
What are the 5 examples of data?
Five examples of types of data are numerical (quantitative), categorical (qualitative), ordinal (ordered categories), time-series (collected over time), and spatial (geographic coordinates).
What is data analysis with real-life examples?
Data analysis with real-life examples could include tracking student performance over time to identify factors that impact academic success or analyzing patient health records to improve medical treatments based on outcomes.
What is data with an example?
Data is information that is collected or stored for reference or analysis. An example of this could be a spreadsheet containing sales figures for a company's products over a certain period.
What is a data analytics use case?
An example use case of data analytics could be predicting customer churn for a telecommunications company by analyzing historical customer behavior and identifying factors that contribute to customers leaving their service.
What are some types of data analysis?
The four types of data analysis are diagnostic (identifying reasons behind events), exploratory (finding relationships between variables), confirmatory (confirming hypotheses with new datasets), quantitative data analysis, and explanatory (explaining why events occurred).
What is the role of a data analyst?
The role of a data analyst is to collect, clean, analyze, interpret, and visualize large amounts of complex information to help organizations make informed decisions based on evidence rather than intuition.
What are the data analysis methods?
To conduct effective data analysis one must first define objectives clearly, gather relevant datasets from credible sources, clean and prepare the datasets appropriately by removing errors or duplicates, analyze them using appropriate statistical methods or tools, interpret results accurately draw meaningful insights, and finally communicate findings effectively through visualizations or reports.


