


When it comes to business intelligence tools, Looker and Tableau are two of the most popular options in the market. Both platforms offer powerful features for transforming and analyzing data, creating interactive visualizations, and sharing insights with end users.
Looker focuses on providing a comprehensive platform for data analysis, allowing users to explore and analyze data in a user-friendly interface. It offers features such as dashboard creation, data exploration, and collaboration tools.
Tableau is known for its robust visualization capabilities and ease of use. It enables users to create highly customized dashboards and reports by dragging and dropping elements onto the canvas. Tableau also offers advanced analytics features such as predictive modeling and geospatial analysis.
In this article, we will compare Looker and Tableau across various criteria to help you determine which platform is better suited for your organization's needs.
Importance of Business Intelligence Software:

Business intelligence tools are crucial in business analytics by helping organizations make sense of large and complex data sets. Here are some key reasons why BI tools are important in business analytics:
1. Simplifying complex data:
BI tools enable users to present complex data in a visually appealing and easy-to-understand format. Creating charts, graphs, and dashboards, these tools help businesses identify trends, patterns, and outliers within their data quickly.
2. Identifying KPI's:
By visualizing key performance indicators (KPIs) and metrics, businesses can easily spot opportunities for growth or areas that require improvement. Data visualization tools help organizations stay ahead of the competition by identifying market trends and potential threats.
3. Improving communication:
Data visualization tools facilitate effective communication within an organization by providing a common platform for sharing insights and analysis. Visual representations of data are more engaging and easier to understand than raw numbers or text reports.
4. Real-time reporting capabilities:
By automating the process of creating visualizations, businesses can save time and resources on manual data analysis tasks. Data visualization tools allow users to generate real-time reports and dashboards, enabling faster decision-making processes.
5. Helps to focus on analysis:
Data visualization tools empower businesses to explore new ideas and experiment with different scenarios based on their data. Organizations can innovate products, services, and processes by visualizing trends and patterns to meet changing customer needs.
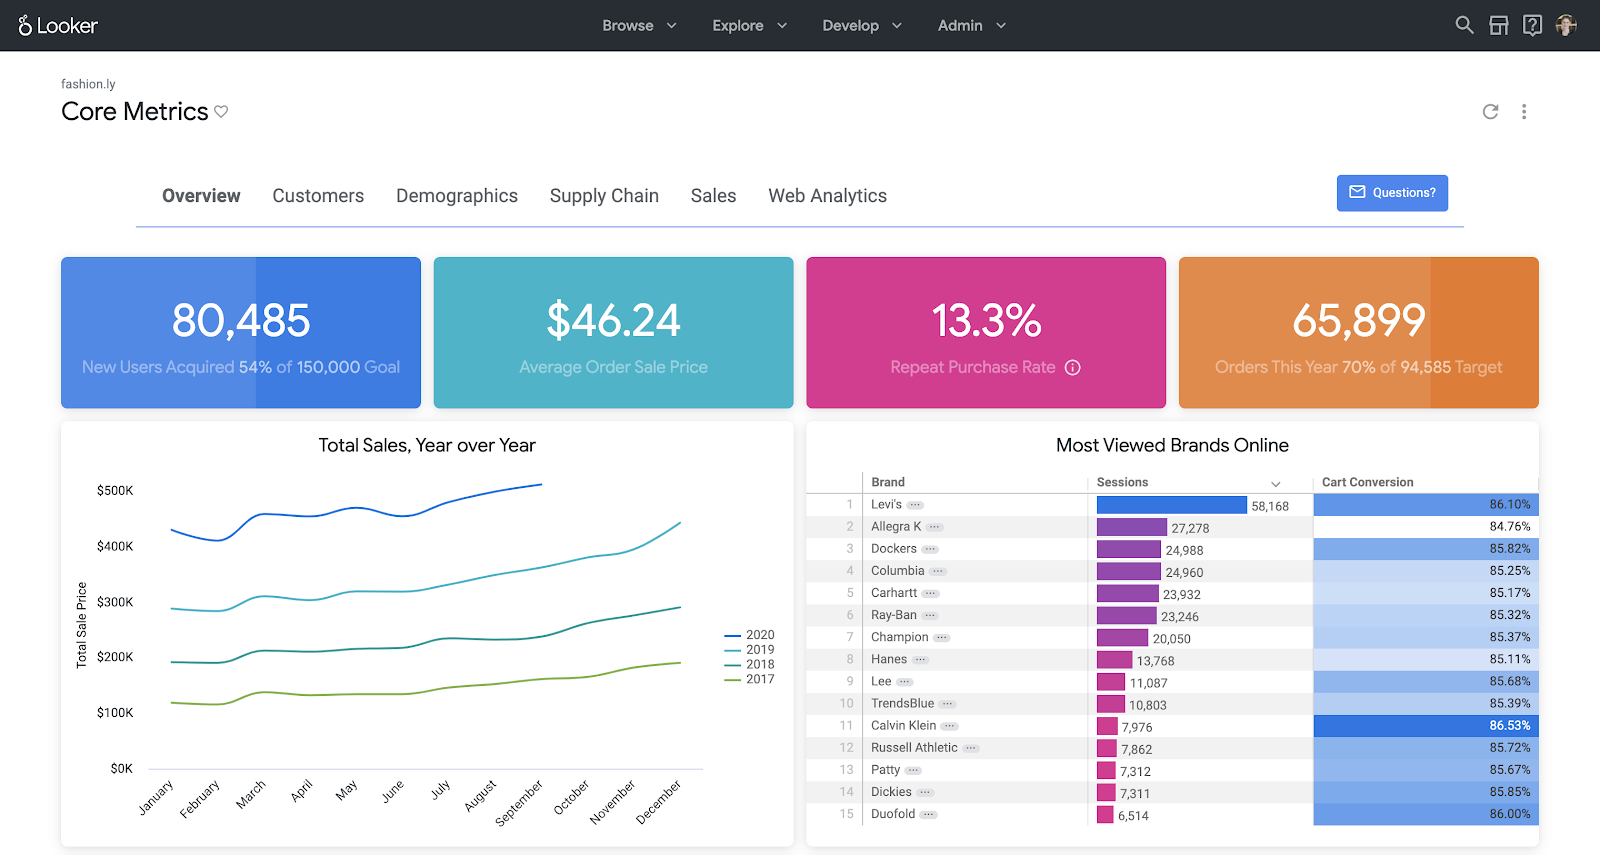
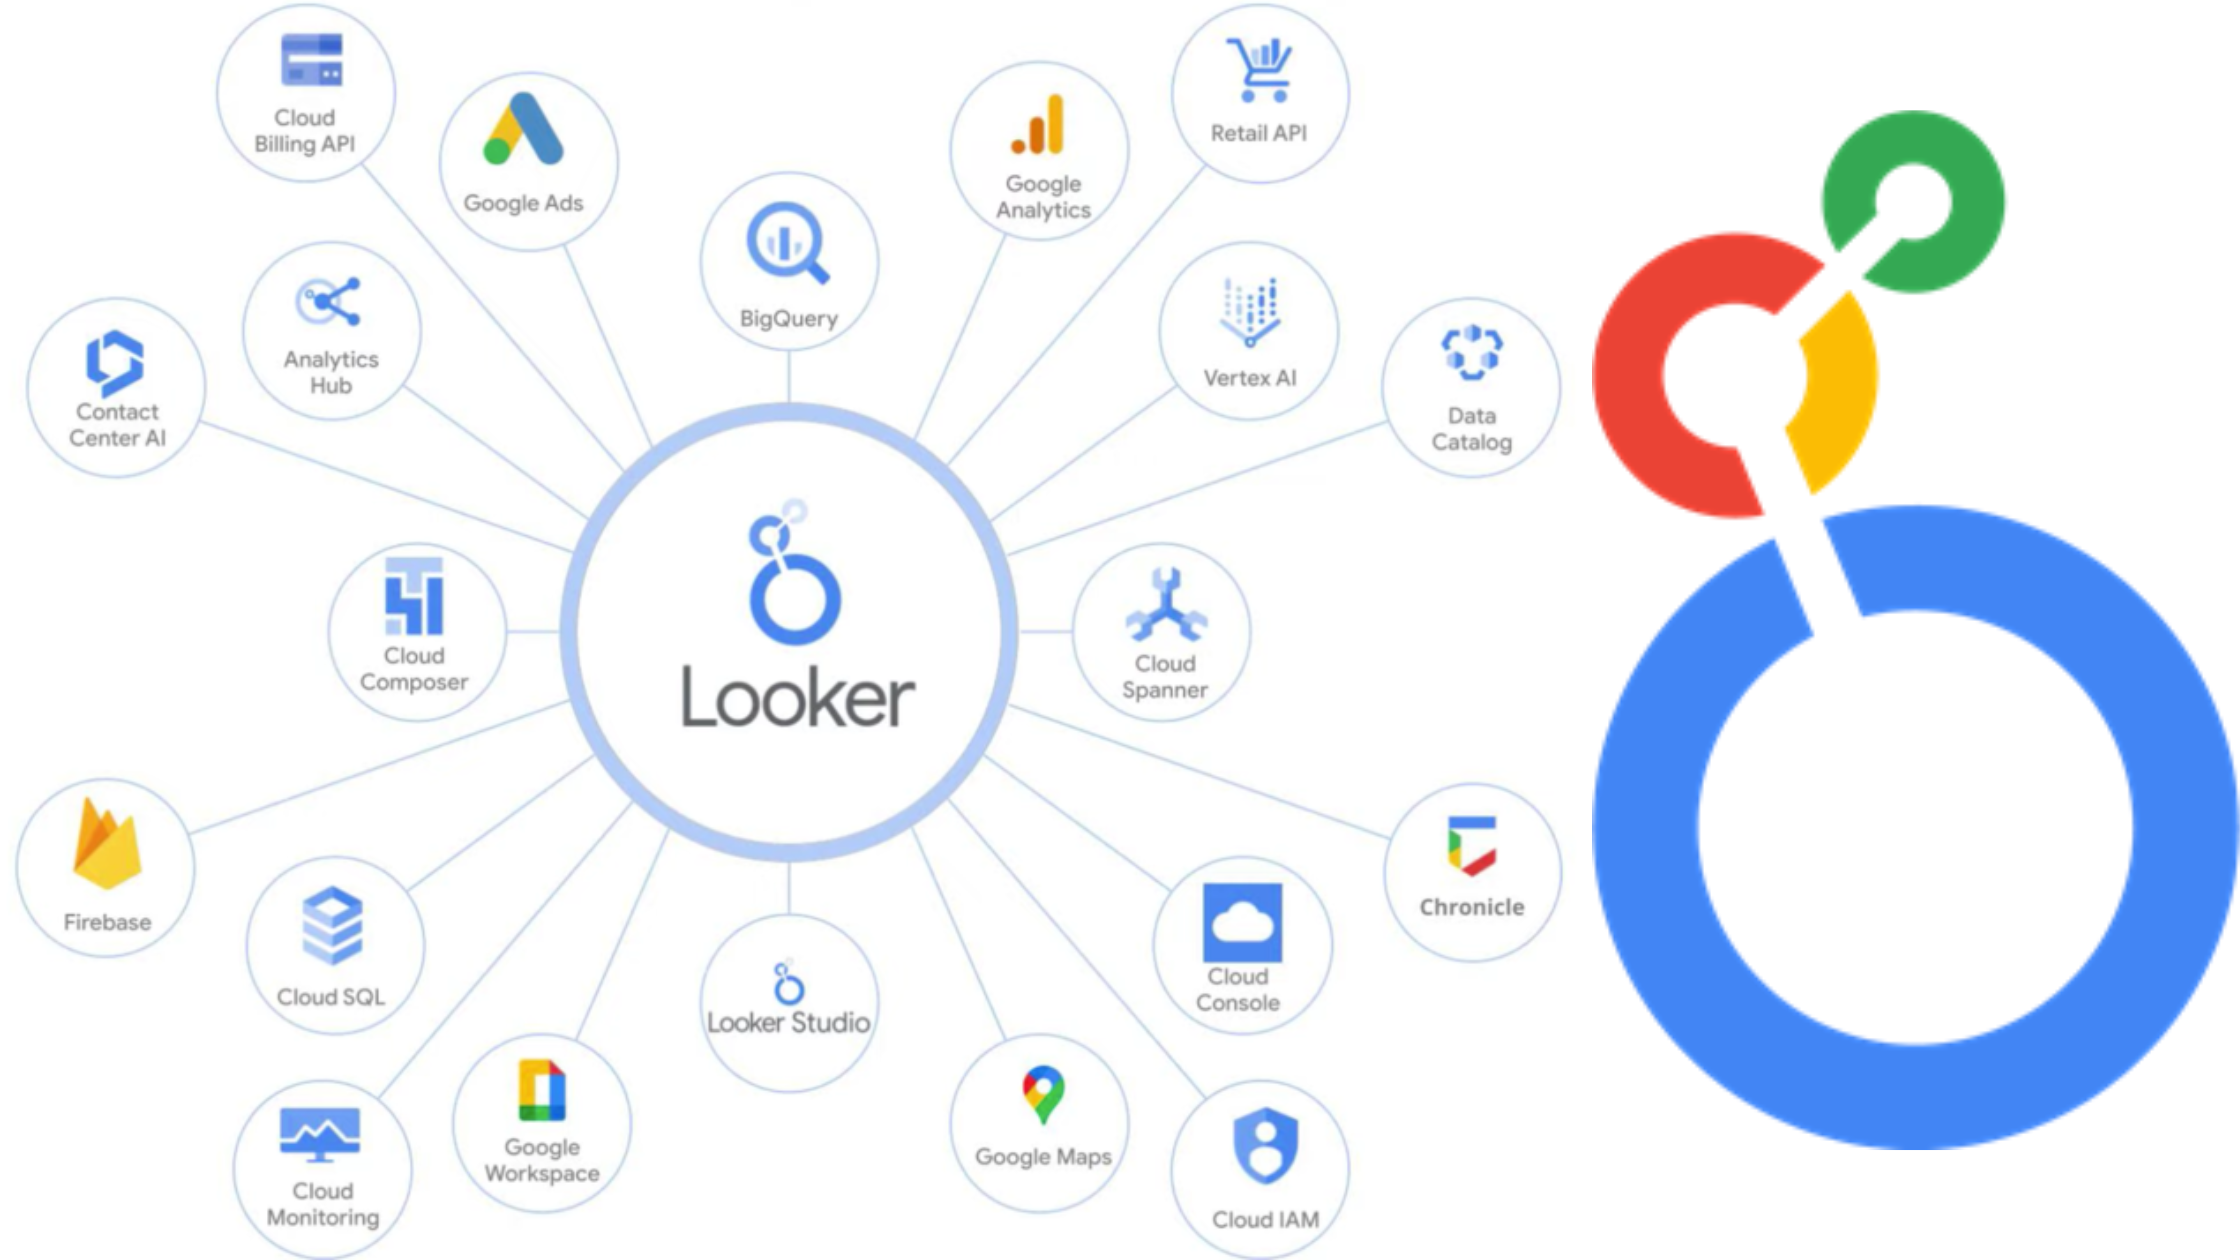
Looker History & Origin

Looker is a business intelligence software company that was founded in 2012 and based in Santa Cruz, California, and has since been acquired by Google Cloud in 2019.
Looker’s platform is built on top of SQL, which allows users to write custom queries and generate reports with ease. The software also includes a drag-and-drop interface, making it easy for non-technical users to visualize data and create dashboards.
One of the key features of Looker is its ability to centralize data from multiple sources, such as databases, APIs, and cloud services. This allows organizations to gain a comprehensive view of their data and make informed decisions based on accurate insights.
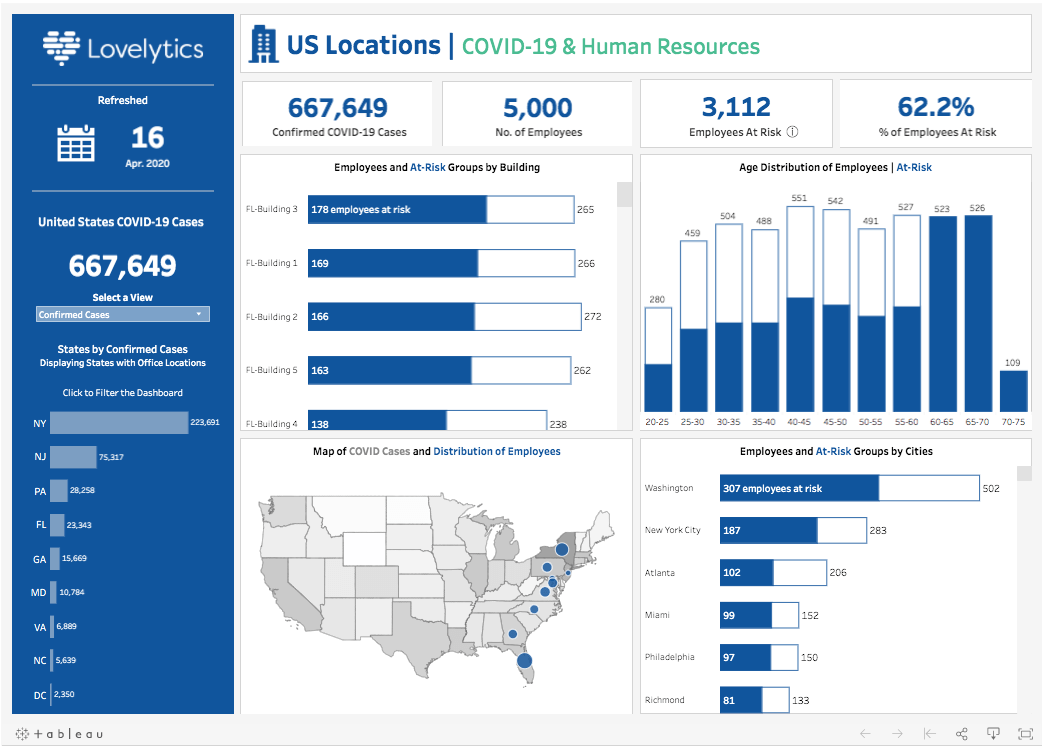
Tableau History & Origin

Tableau was founded in 2003 with the vision to make it easier for people to visualize and understand complex data. The traditional business intelligence tools were too cumbersome and difficult to use, so Tableau came out as a more intuitive and user-friendly alternative.
The first version of Tableau was released in 2004, and it quickly gained popularity among businesses and organizations looking for a better way to analyze their data. Its interactive dashboards and drag-and-drop interface made it easy for users to explore their data and uncover insights without needing advanced technical skills.
Looker VS Tableau: Data Sources
Data connectivity is a crucial component in any data analytics tool, as it determines how easily and efficiently users can access and analyze their data. Let us discuss the data connectivity options in Looker and Tableau.
Looker
Looker offers native connectors to various databases such as SQL Server, MySQL, PostgreSQL, and more and also supports connections to cloud-based data sources like Google BigQuery and Amazon Redshift.
Looker is known for its complex data modeling and data preparation capabilities, which allow users to define relationships between different data models and create reusable metrics and dimensions. This makes it easier for users to analyze complex datasets and derive valuable insights.
Tableau
Tableau offers native connectors to popular databases like Oracle, Microsoft Azure SQL Database, Snowflake, and many others. It also has built-in integrations with cloud platforms such as Amazon Web Services (AWS) and Google Cloud Platform.
While Tableau may not have the same level of data modeling capabilities as Looker, it excels in its ability to quickly connect to a wide range of data sources.
Looker’s focus on data modeling allows for more advanced analysis of complex datasets but may require additional setup time. Whereas, Tableau’s broad range of native connectors makes it easier for users to quickly connect to their data sources without much configuration.
Looker VS Tableau: Data visualization capabilities
Both platforms offer a wide range of chart options that can help users better understand their data and make informed decisions. In this section, we will compare the chart options available in Looker and Tableau to help you decide which tool is best suited for your needs.
Looker

Looker offers a variety of chart types that can be easily customized to suit individual preferences. Some of the most commonly used chart options in Looker include
- bar charts,
- line charts,
- pie charts,
- scatter plots,
- heat maps.
These charts can be created with just a few clicks and can be further customized by adjusting colors, fonts, labels, and other visual elements.
Tableau

Tableau also offers a wide selection of chart options that allow users to visualize their data in different ways. Some of the popular chart types in Tableau include
- bar graphs,
- line graphs,
- area charts,
- scatter plots,
- histograms, and
- box plots.
Tableau's drag-and-drop interface makes it easy to create visually stunning charts that can be customized with various formatting options.
Looker provides users with a simple interface for quickly generating basic charts, whereas Tableau gives users more advanced customization options such as dual axes, trend lines, reference lines, annotations, and calculated fields. This allows users to create highly detailed and interactive visualizations that can uncover hidden insights within their data.
Looker VS Tableau: Collaboration Capabilities
Both platforms offer powerful features for analyzing and visualizing data, they also have their unique strengths when it comes to collaboration capabilities.
Looker

Looker is known for its robust collaboration features that allow teams to work together seamlessly on projects. One of the key features of Looker is its ability to create shared dashboards and reports that can be easily accessed and viewed by team members. This makes it easy for multiple users to collaborate on a project and share insights in real time.
Looker supports embedded analytics that can be extremely useful for teams who want to share their findings with stakeholders or clients without having to export and send files manually.
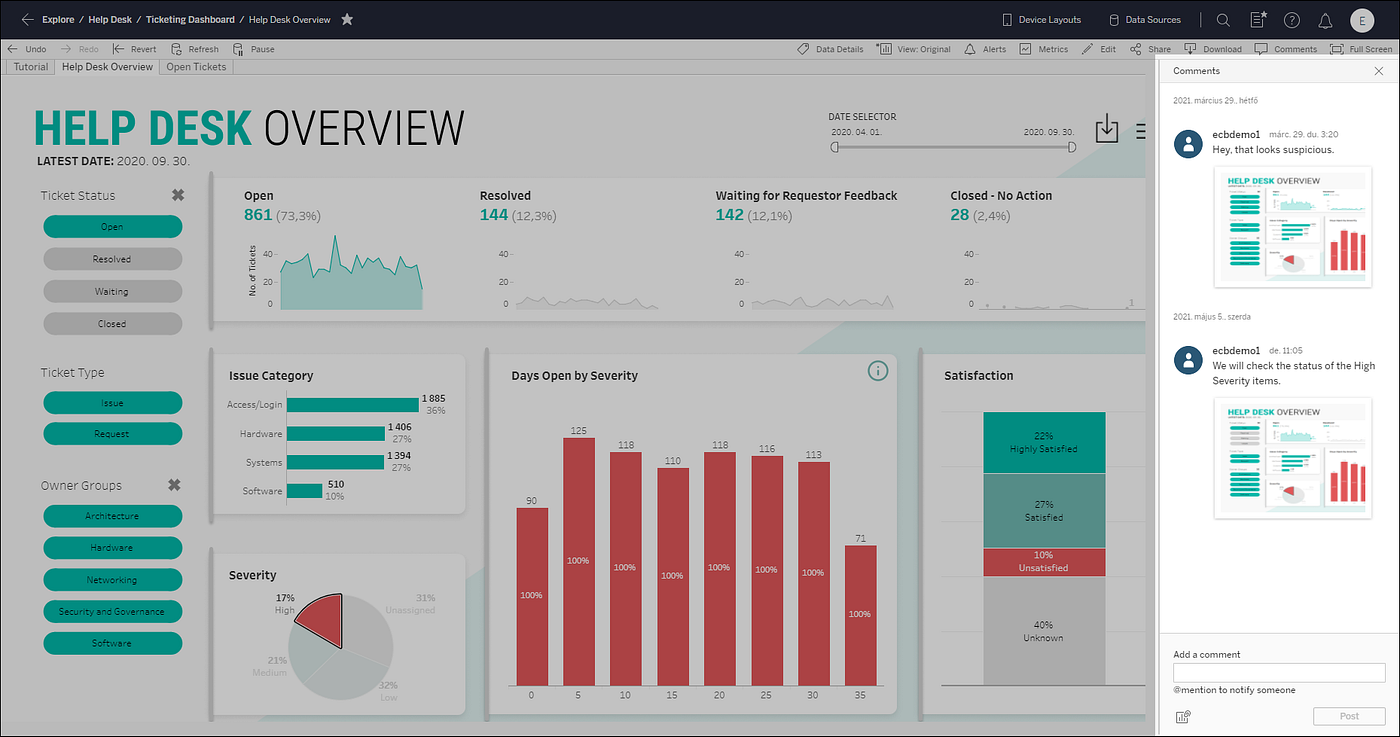
Tableau

Tableau also offers strong collaboration capabilities through its online platform, Tableau Online. With Tableau Online, users can share workbooks and visualizations with others, as well as collaborate on projects in real time. Users can also comment on specific data points or visualizations, making it easier for teams to communicate and work together effectively.
Tableau also has a feature called Tableau Public, which allows users to publish their visualizations online for anyone to view. This can be a great way for teams to showcase their work to a wider audience and gather feedback from other professionals in the industry.
Looker vs Tableau: Pricing
In this section let us discover the pricing plans for both Looker and Tableau.
Looker
The pricing for Looker is based on a subscription-based model, where customers pay a flat fee per user per month. The exact cost can vary depending on the number of users and the specific features you need but typically ranges from $50 to $150 per user per month.
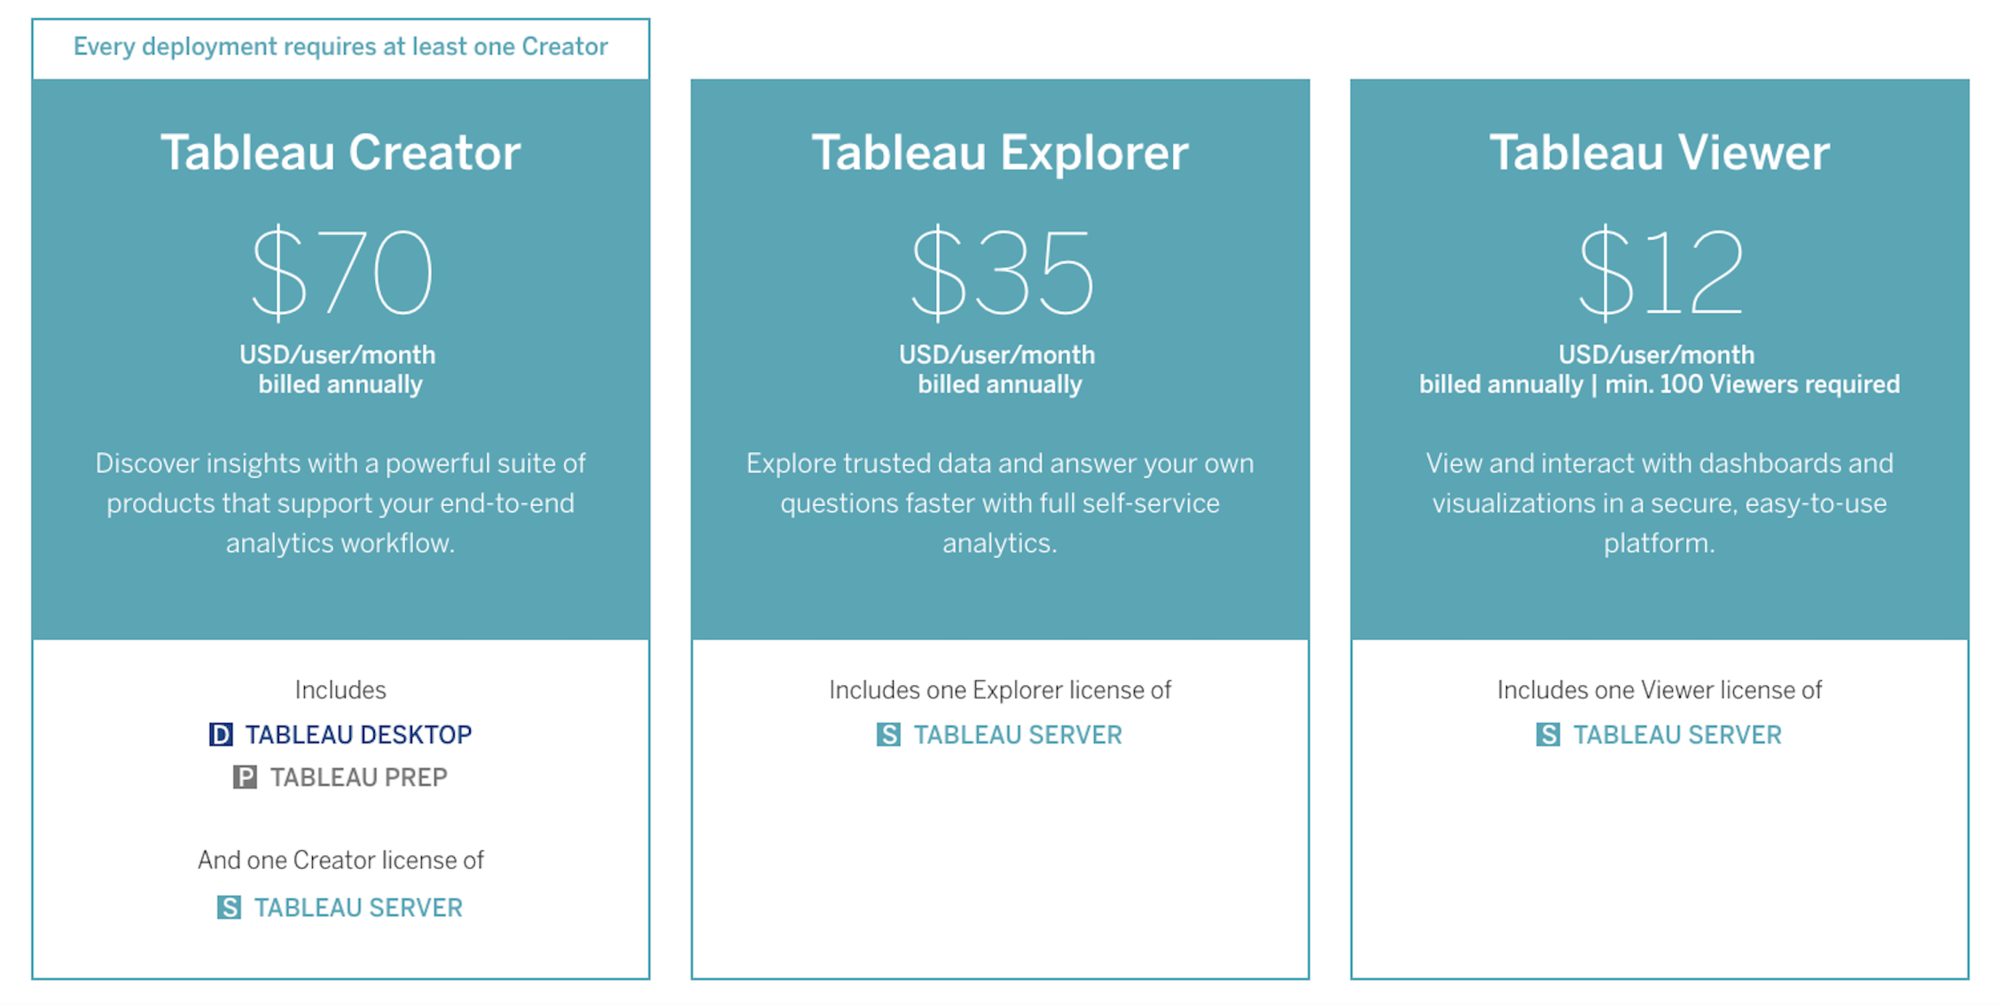
Tableau

Tableau offers both on-premise and cloud-based solutions, with pricing based on a combination of licensing fees and maintenance costs. Tableau's pricing can be more complex compared to Looker, as it factors in the number of users, deployment type (on-premise or cloud), and additional services like training and support. The starting price for Tableau Desktop is around $70 per user per month, while the server version starts at around $35 per user per month.
Overall, Looker may appear to be more expensive upfront due to its subscription-based model but Looker's subscription model allows for easy scaling as your organization grows. However, Tableau's pricing can add up quickly if you have a large number of users or require additional services like training and support.
Looker VS Tableau: Use Cases
Here are some common scenarios where each platform should be used accordingly:
Looker is well-suited for
- Organizations with complex data structures that require extensive SQL querying.
- Companies looking to unify their disparate data sources into one centralized platform.
- Teams that need to collaborate on analyses in real-time.
Tableau is well suited for:
- Users who prioritize visual aesthetics and storytelling in their data presentations.
- Organizations that want to leverage advanced analytics capabilities like predictive modeling.
- Businesses with a strong focus on geospatial analysis or location-based insights.
Conclusion
As data continues to play a critical role in business decision-making, the need for powerful business intelligence tools has become increasingly important. Looker is a powerful business intelligence platform that offers features such as embedded analytics, data exploration, and collaboration tools. Whereas Tableau is a leading data visualization tool that enables users to create interactive visualizations from various data sources offering features such as drag-and-drop functionality, real-time analytics, and storytelling capabilities.
If you are looking for an alternative to both Looker and Tableau that provides similar functionality at a lower cost, Sprinkle Data is worth considering. Sprinkle Data is a self-service BI platform that contains advanced drill-down, and data breakout capabilities in dashboards. Click here to get started with the platform
Frequently Asked Questions FAQs - Looker vs Tableau
What are the limitations of Looker Studio?
Looker Studio has limitations in terms of customization options, as it does not offer extensive flexibility for creating highly customized visualizations. The free version of Looker Studio has limitations on the number of users and data sources that can be connected, making it less suitable for larger organizations with complex data needs.
What problem does Looker solve?
Looker solves the problem of centralizing and analyzing large amounts of data from various sources to provide actionable insights for businesses. It allows users to create interactive dashboards and reports to visualize data trends and patterns.
Why is Looker so slow?
The slowness of Looker can be attributed to factors such as the complexity of queries, the volume of data being processed, and issues with server performance. Optimizing query performance and improving server infrastructure can help address these speed issues.
Is Looker a competitor to Tableau?
While both Looker and Tableau are data visualization tools, they serve different purposes. Looker focuses more on data modeling and analytics workflows, while Tableau is known for its robust visualization capabilities. The choice between the two tools depends on the specific needs and preferences of an organization.
Is Looker better than Data Studio?
Looker may have a steeper learning curve compared to Google Data Studio due to its more advanced features and functionalities. However, with proper training and resources, users can become proficient in using Looker effectively.
Is Looker costly?
In terms of cost, Looker can be expensive for smaller organizations or those with limited budgets due to its pricing structure based on user licenses and data usage. Additionally, additional costs may be incurred for advanced features or integrations.
What are the disadvantages of Looker?
Is Looker cheaper than Tableau?
When comparing Looker to Tableau in terms of cost, Looker may be cheaper depending on the size of the organization and its specific needs. However, Tableau offers a wider range of features and functionalities that may justify its higher price point for some users.
Is Looker more expensive than Tableau?
Other tools that are considered better than Tableau include Microsoft Power BI, QlikView, and Domo. These tools offer similar functionalities but may have different strengths or advantages depending on the use case.
Which tool is better than Tableau?
Is Tableau similar to Looker?
While Tableau focuses more on data visualization capabilities, Looker emphasizes data modeling and analysis workflows. Both tools serve complementary functions in a business intelligence stack rather than directly competing with each other.
Is Looker a competitor to Tableau?
Overall, Looker competes with Tableau in the business intelligence market by providing advanced analytics capabilities focused on data modeling and insights generation. Depending on specific requirements, one tool may be preferred over the other for certain use cases or industries.


