


Introduction
In the realm of data analysis, the choice of the right visualization tool can often delineate between insightful discoveries and mere data accumulation. Tableau and Excel stand as stalwarts in this domain, offering distinct yet complementary functionalities. Tableau, heralded for its prowess in dynamic visualizations and real-time analytics, presents a canvas where data comes alive, fostering interactive exploration and storytelling. On the other hand, Excel, a venerable spreadsheet software, champions a stronghold in calculations, financial modeling, and basic data manipulation within a familiar interface.
Understanding the nuanced differences and strengths of Tableau and Excel is paramount in navigating the vast landscape of data analysis. Both tools cater to professionals in the data science field, with Tableau being particularly favored among data scientists for its advanced visualization capabilities and efficiency. While Tableau’s forte lies in handling large datasets, crafting interactive dashboards, and illuminating complex and underlying data and relationships, Excel remains a steadfast choice for smaller-scale analysis, customized calculations, and spreadsheet-based functionalities. Delving deeper into the contrasting capabilities of these tools unveils a spectrum of applications, empowering users to leverage their specific strengths for precise and effective data-driven decision-making.
Tableau vs Excel - Understanding the Differences
1. Data Visualization Capabilities:

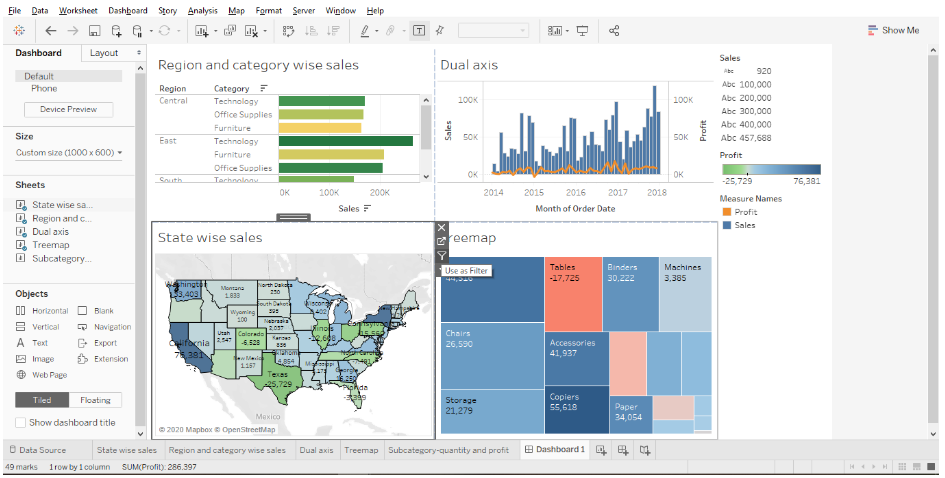
- Tableau: As a leading data visualization software, Tableau offers advanced and interactive visualizations, allowing users to create dynamic dashboards with a wide array of chart types, maps, and filters.
- Excel: Provides basic charting features, suitable for creating static graphs and simple charts within the spreadsheet environment.
2. Handling Large Datasets:

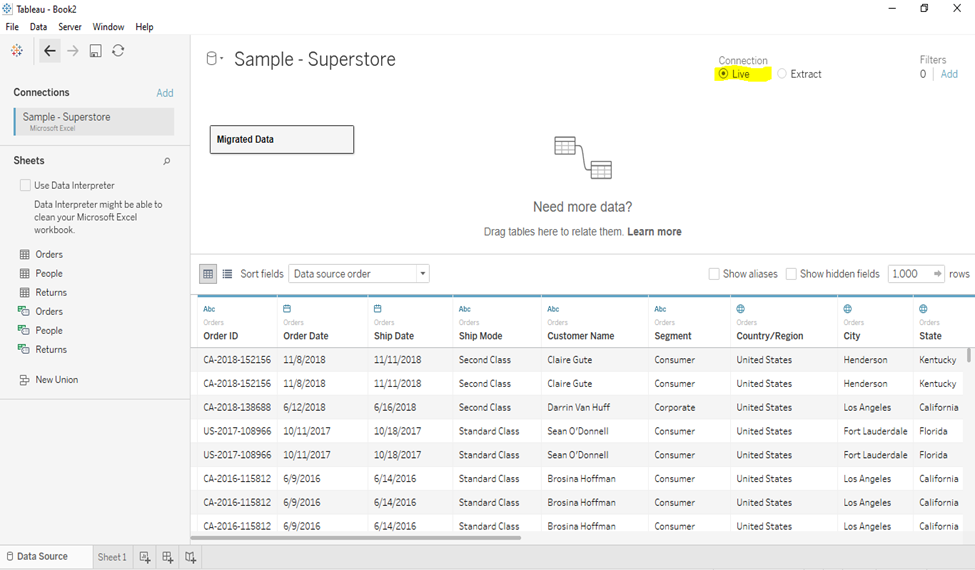
- Tableau: Excels in handling large datasets efficiently, with the ability to connect to various data sources directly and perform real-time analysis without compromising performance.
- Excel: Performs well with smaller datasets but might face limitations or decreased performance with large volumes of data. When dealing with excel data volumes, it struggles with larger datasets, leading to performance issues. It operates primarily within the spreadsheet interface.
3. Real-time Data Analysis:

- Tableau: Allows for live connections to data sources, enabling real-time data analysis and updates.
- Excel: Typically operates with static connections to data sources, making real-time analysis less feasible compared to Tableau.
4. Calculation and Analysis:
- Tableau: Focuses primarily on data visualization and exploration, offering limited built-in functions for complex calculations and analysis.
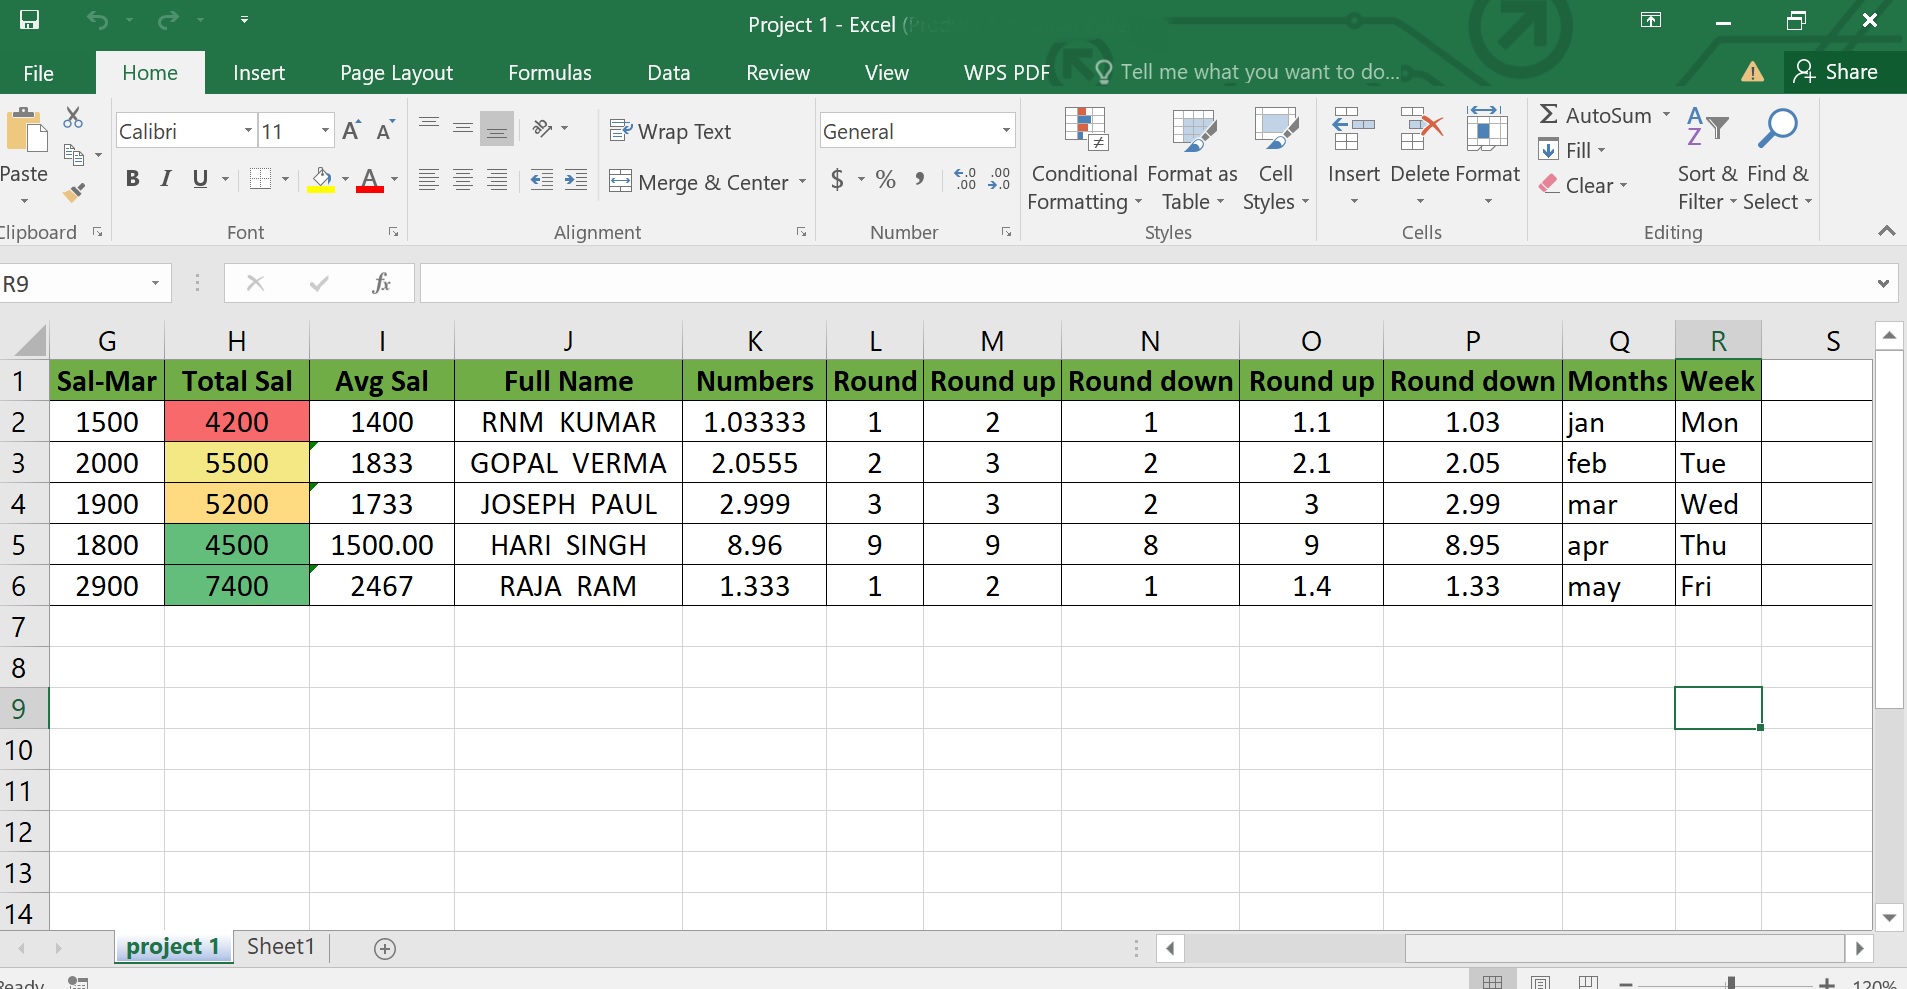
- Excel: Renowned for its extensive library of formulas and functions, including a majority of mathematical and logical functions, making it suitable for performing intricate calculations, statistical analysis, and financial modeling.
5. Interactive Dashboards:

- Tableau: Specializes in creating interactive and shareable dashboards, facilitating better data storytelling and comprehension.
- Excel: Offers more static dashboard creation, with limited interactivity compared to Tableau’s dynamic dashboard capabilities.
6. Flexibility in Data Representation:
- Tableau: Provides more flexibility in representing data through various visualization formats, including geographical plots, heat maps, and complex visualizations.
- Excel: While capable of representing data visually, it has fewer options for diverse and advanced visualization techniques compared to Tableau.
7. Ease of Use for Visualization:
- Tableau: Known for its user-friendly interface, allowing for intuitive drag-and-drop functionality to create complex visualizations without extensive technical knowledge.
- Excel: Requires a certain level of familiarity with formulas and functions to create and customize visualizations, making it less intuitive for complex charts.
8. Collaborative Analysis:
- Tableau: Provides collaborative features, allowing multiple users to work simultaneously on visualizations and dashboards, fostering teamwork and sharing insights.
- Excel: Collaboration in Excel often involves sharing spreadsheet files, which can lead to version control issues and difficulties in real-time collaboration.
9. Performance with Big Data:

- Tableau: Efficiently handles and processes large datasets, making it suitable for big data analysis without sacrificing speed or performance.
- Excel: While capable, Excel might face performance issues or limitations when dealing with massive volumes of data, impacting processing speed.
10. Cost and Licensing:
- Tableau: Often comes with a subscription-based pricing model, with different tiers offering varying features and scalability.
- Excel: Generally included in the Microsoft Office suite, making it more accessible for basic data analysis needs without additional costs, but may require additional licenses for advanced functionalities.
11. Connectivity and Data Sources:
- Tableau: Offers seamless connectivity to multiple data sources like databases, cloud services, and big data platforms, allowing live data connections for real-time analysis.
- Excel: Primarily operates with data imported into spreadsheets, often requiring manual updates or static connections to external data sources.
12. Automation and Scripting:
- Tableau: Provides limited scripting capabilities with Tableau Prep for data preparation tasks but generally focuses on a more visual and intuitive interface.
- Excel: Allows for extensive automation and scripting through macros and Visual Basic for Applications (VBA), enabling users to create custom functions and automate repetitive tasks.
13. Mobile Compatibility:
- Tableau: Optimized for mobile devices, offering responsive and interactive dashboards that adapt to various screen sizes for on-the-go data analysis.
- Excel: While usable on mobile devices, the spreadsheet interface might not be as user-friendly or optimized for mobile viewing compared to Tableau.
14. Geospatial Analysis:
- Tableau: Provides robust geospatial analysis tools, allowing users to visualize data on maps with detailed geographical analysis and custom mapping functionalities.
- Excel: Has limited geospatial analysis capabilities, with fewer options for detailed mapping and geographic visualization compared to Tableau.
15. Learning Curve and Training:
- Tableau: Known for its relatively shorter learning curve, offering user-friendly interfaces and extensive online training resources for beginners and advanced users alike.
- Excel: Widely used and understood but might have a steeper learning curve for mastering advanced functionalities and complex formulas.
16. Scalability and Performance:
- Tableau: Designed for scalability, allowing organizations to scale their analytics infrastructure as their data needs grow, maintaining performance efficiency.
- Excel: Might face performance issues or become unwieldy as datasets grow larger, limiting scalability compared to Tableau's scalability options.
17. Presentation and Storytelling:
- Tableau: Emphasizes storytelling through data, enabling users to create compelling narratives using visualizations and dashboards for effective communication.
- Excel: While capable of presenting data, it might require additional effort to craft engaging narratives or stories compared to Tableau's storytelling features.
18. Data Security and Governance:
- Tableau: Offers robust data security features, allowing administrators to control access, permissions, and data governance within the platform.
- Excel: Lacks centralized governance and might pose challenges in managing access controls and ensuring data security across multiple spreadsheets.
19. Customer Support and Community:
- Tableau: Provides dedicated customer support and a thriving user community offering forums, knowledge bases, and resources for troubleshooting and learning.
- Excel: Relies on general Microsoft Office support and online forums, with extensive resources but might lack the specialized support available for Tableau users.
21. Automation and Workflow:
- Tableau: Offers limited automation capabilities within Tableau Prep for data preparation tasks but focuses more on visual and interactive analysis rather than extensive automation.
- Excel: Employs Visual Basic for Applications (VBA) to enable robust automation, allowing users to create custom functions, automate tasks, and build sophisticated workflows.
22. Data Cleaning and Preparation:
- Tableau: Provides basic data preparation features within Tableau Prep, allowing users to clean and transform data to a certain extent before visualization.
- Excel: Offers a wide range of data cleaning and transformation functions within the spreadsheet, allowing for detailed data cleansing and preparation.
23. Forecasting and Predictive Analysis:
- Tableau: Provides limited forecasting capabilities within the tool, focusing more on visualizing historical data rather than advanced predictive analysis.
- Excel: Offers various statistical functions and add-ins for predictive modeling, making it suitable for forecasting and predictive analysis tasks.
24. Version Control and Collaboration:
- Tableau: Offers version control for workbooks, facilitating collaboration and tracking changes made by multiple users, enhancing team collaboration.
- Excel: Collaboration in Excel might involve shared files, potentially leading to version control issues and challenges in simultaneous editing.
25. Customization and Extensibility:
- Tableau: While offering various customization options within the tool, Tableau's extensibility might be more limited compared to Excel's extensive customization through macros and scripting.
- Excel: Allows for extensive customization and extensibility through VBA, enabling users to create highly tailored and specific functionalities.
When to Use Tableau:

1. Exploratory Data Analysis: Tableau excels in exploring vast and complex datasets, allowing users to conduct detailed analysis and uncover patterns, trends, and outliers efficiently through comprehensive and interactive visualizations.
2. Large Dataset Visualization: For datasets with numerous variables or significant volume, Tableau’s ability to help users analyze data and visualize it in a user-friendly manner makes it the preferred choice for data analysts.
3. Real-time Analytics: When real-time analysis and immediate insights from live data sources are crucial, Tableau's live connections offer dynamic and up-to-date data source visualizations.
4. Interactive Dashboards and Storytelling: Tableau is ideal for creating interactive dashboards and compelling data stories, facilitating better communication and engagement with stakeholders.
5. Geographic and Spatial Analysis: For geographical data analysis and mapping, Tableau's robust geospatial analysis tools make it an excellent choice for visualizing data on maps.
6. Collaborative Analysis: When collaboration among multiple users is necessary for simultaneous analysis or dashboard creation, Tableau's collaborative features are beneficial.
7. Executive Presentations: Tableau's visually appealing dashboards and interactive visualizations are perfect for presenting insights and key performance indicators (KPIs) to executives.
8. Big Data Exploration: When dealing with big data or diverse datasets, Tableau's scalability and performance ensure efficient handling and exploration of large volumes of information.
9. Marketing and Sales Analytics: For marketing campaigns or sales analyses that require detailed data visualization tool each of customer behavior, Tableau offers a comprehensive view of data for better decision-making.
10. Data-Driven Decision Making: In situations where data-driven decisions are paramount, Tableau's ability to extract data and to transform raw data into actionable insights aids in informed decision-making processes.
When to Use Excel:

1. Small Dataset Analysis: Excel is well-suited for handling smaller datasets or performing simple calculations and analysis where the complexity is relatively low.
2. Spreadsheet-based Calculations: For basic data manipulation, budgeting, and performing straightforward calculations to manipulate data within a spreadsheet, Excel's formula library is efficient.
3. Financial Modeling: Excel remains a popular choice for financial modelling spreadsheet data mining, accounting, and creating complex financial reports due to its extensive financial functions.
4. Personal Budgeting and Planning: Individual users often prefer Excel for personal budgeting, planning, and tracking expenses due to its familiarity and ease of use.
5. Tabular Data Organization: When the primary need is to organize data in tabular form or maintain structured lists and pivot tables, Excel's spreadsheet format is straightforward and effective.
6. Statistical Analysis: For basic statistical analysis or running statistical tests, Excel provides a range of statistical functions and tools for analysis.
7. Customized Calculations: When users require customized or specialized calculations with the ability to script or automate specific tasks, Excel's scripting capabilities come in handy.
8. Data Entry and Record Keeping: Excel's user-friendly interface makes it suitable for data entry tasks or maintaining records, especially in scenarios where data volumes are moderate.
9. Basic Charting and Graphs: For creating basic charts, graphs, or simple visual representations of data within a spreadsheet environment, Excel's charting tools suffice.
Use Cases and Recommendations:
Recommendations for Tableau:
- Business Intelligence and Analytics: Use Tableau for comprehensive business intelligence (BI) and analytics tasks, especially when dealing with large and diverse datasets that demand advanced visualizations and real-time insights.
- Interactive Dashboards for Stakeholders: Leverage Tableau to create interactive dashboards and reports for stakeholders and executives, facilitating better data-driven decision-making through engaging visual narratives.
- Geospatial Analysis and Mapping: Employ Tableau for geospatial analysis and mapping tasks, particularly when visualizing geographical data and exploring spatial relationships.
- Big Data Exploration: Utilize Tableau for analyzing and exploring big data, leveraging its scalability and efficiency in handling extensive datasets without compromising performance.
- Data Storytelling and Presentations: Choose Tableau for crafting compelling data stories and presentations, enabling effective communication of insights and trends to diverse audiences.
Recommendations for Excel:
- Small-scale Data Analysis: Excel remains a reliable choice for smaller-scale data analysis tasks, including budgeting, basic calculations, and simple data manipulation where complex visualizations are unnecessary.
- Financial Modeling and Accounting: Excel is well-suited for financial modelling, accounting, and creating detailed financial reports, utilizing its extensive financial functions and spreadsheet capabilities.
- Statistical Analysis and Calculations: Use Excel for basic statistical analysis and calculations, leveraging its array of statistical functions and tools within the spreadsheet interface.
- Customized Calculations and Scripting: Employ Excel for tasks requiring customized calculations, automation through scripting, or the creation of specific functions using VBA.
- Personal or Small Team Usage: Excel is suitable for personal use or within small teams for data organization, simple charting, and record-keeping tasks due to its widespread familiarity and accessibility.
Recommendations Summary:
- Tableau: Opt for Tableau when dealing with large datasets, complex visualizations, geospatial analysis, real-time analytics, and when data storytelling and engaging presentations are paramount.
- Excel: Choose Excel for smaller-scale analysis, financial modeling, statistical calculations, customized scripting, and for scenarios where familiarity, basic charting, and personal or small team usage are essential.
Conclusion:
The comparison between Tableau and Excel underscores two key differences and the diverse yet complementary nature of these data analysis tools. Tableau's emphasis on dynamic visualizations, interactive dashboards, and real-time analytics marks a paradigm shift in data exploration, empowering users to uncover insights and craft compelling narratives from vast and intricate datasets. Excel, with its longstanding legacy as a spreadsheet powerhouse, remains a cornerstone for smaller-scale analysis, financial modelling, and customized calculations, providing a familiar interface for users worldwide.
The discerning distinctions between Tableau and Excel, spanning data handling, visualization capabilities, and analytical depth, offer a nuanced understanding of their respective strengths. While Tableau excels in handling large volumes of data, visual storytelling, data filtering, and real-time insights, Excel's versatility and extensive formula library cater to varied analytical needs, especially in scenarios demanding meticulous calculations and financial modelling.
Selecting the ideal tool, therefore, hinges on the specific requirements of data analysis tasks. Leveraging Tableau's prowess for big data exploration, interactive dashboards, and comprehensive visual storytelling, or harnessing Excel's familiarity and customization as a spreadsheet tool for smaller-scale analyses and tailored calculations ensures a strategic alignment of tools with organizational objectives.
In this era of data-driven decision-making and data analytics, the nuanced capabilities of Tableau and Excel empower users to unravel the complexities of data, fostering informed insights and facilitating precision in analysis across diverse analytical landscapes.
Frequently Asked Questions (FAQs): Tableau vs Excel
Is Tableau suitable for beginners in data analysis?
Yes, Tableau offers a user-friendly interface and numerous online resources, making it accessible for beginners to start exploring and analyzing data.
Can Tableau handle real-time data connections?
Yes, Tableau supports live connections to various data sources, enabling real-time data analysis and updates.
What are the advantages of using Tableau for data visualization over Excel?
Tableau offers advanced and interactive visualizations, allowing for more sophisticated and dynamic dashboard creation compared to Excel's basic charting capabilities.
How does Tableau handle large datasets compared to Excel?
Tableau is better equipped to handle large datasets efficiently and perform real-time analysis without compromising performance, whereas Excel might face limitations with larger volumes of data.
Can Tableau perform complex calculations like Excel?
While Tableau offers some calculation functionalities, its capabilities are more limited compared to Excel's extensive library of formulas and functions.
Does Tableau offer mobile compatibility for dashboards?
Yes, Tableau provides optimized dashboards for mobile devices, ensuring responsive and interactive views on various screen sizes.
Can Tableau be used for predictive analytics or forecasting?
Tableau provides limited forecasting capabilities but is not primarily focused on advanced predictive analytics, unlike some specialized tools.
Can Tableau perform data cleaning and preparation tasks?
Tableau Prep allows for basic data preparation tasks, but for extensive data cleaning, users might rely on other tools or data preparation platforms.
What kind of customer support or training resources does Tableau provide?
Tableau offers various support resources, including documentation, forums, training videos, and live training sessions for users at different skill levels.
Can Excel handle large datasets efficiently like Tableau?
Excel might face limitations or performance issues with large datasets compared to Tableau, making it more suitable for smaller-scale analysis.
Does Excel have limitations in terms of collaborative work among users?
Excel allows simultaneous editing of files but might pose challenges with version control and real-time collaboration compared to more collaborative platforms.
Can Excel perform geospatial analysis or mapping tasks?
Excel has limited geospatial analysis capabilities compared to Tableau, which offers more robust tools for visualizing geographical data.
Are there specific industries where Excel remains the primary tool for analysis?
Excel is widely used in finance, accounting, and smaller-scale data analysis across various industries due to its familiarity and versatility.
What support or training resources does Microsoft offer for Excel users?
Microsoft provides extensive documentation, online forums, tutorials, and training courses for Excel users through its support platforms.
Can Excel be used for financial modeling and accounting tasks?
Yes, Excel is commonly used for financial modeling, accounting, and creating financial reports due to its extensive financial functions.
Can Excel be used for predictive analytics or forecasting?
Excel offers various statistical functions and add-ins that enable users to perform basic predictive analytics and forecasting tasks.


