

In today's digital landscape, data has become one of the most valuable assets for organizations. With vast volumes of raw data present, there is an urgent need to analyze and derive valuable insights from it. This is where data analytics comes into play. Data analysis is the process of transforming raw data into meaningful information, providing an in-depth understanding of the business processes.
What is Data Analysis?
Data analysis refers to the examination of datasets that involves several steps such as cleaning, transforming, and organizing raw data into a structured format suitable for analysis.
Data Analysis Process:
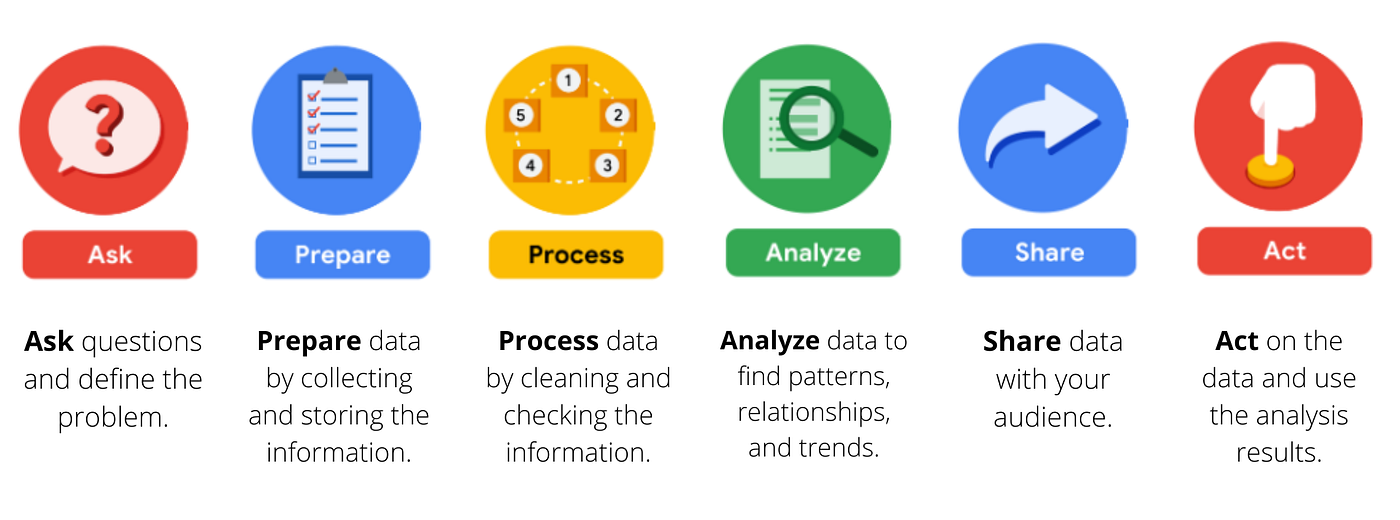
The data analysis process consists of stages from asking the right questions to collecting the data, analyzing it, and eventually finding actionable insights. Let us discuss the data analysis process in depth:

1. Defining Objectives:
Before starting the data analysis journey, it is critical to identify key questions that need answering. This step helps and creates the foundation for the data analysis process.
2. Collection data from sources:
Once objectives are clear, relevant data needs to be collected from different sources such as surveys, databases, social media platforms, etc.
3. Data Cleaning:
Raw data contains errors, inconsistencies, missing values, or outliers that may skew results if not addressed appropriately. Data cleaning involves identifying and correcting these issues to ensure accurate analysis.
4. Exploratory Data Analysis (EDA) & Statistical Analysis:
EDA allows analysts to gain an understanding of data by finding correlations between variables detecting outliers, measure of central tendency, and measure of variability of data. Statistical techniques like regression analysis, hypothesis testing, clustering, or time series forecasting are applied depending on the object and use case.
5. Data Visualization & Sharing:
Visual representations like charts, graphs, or dashboards play a crucial role in presenting findings effectively to stakeholders. It is easy to conclude with the help of graphs and helps to quickly find patterns in data.
6. Interpretation and Decision-making:
Once the analysis is complete, the results are interpreted from the graphs and finally, these insights guide strategic decisions.
Benefits of Data Analysis
Some of the benefits of incorporating data analysis into your business functions are mentioned below:
Helps in Improving Business Processes:
By analyzing historical data, businesses can identify inefficiencies within their operations, leading to process optimization.
Fraud Detection:
Analyzing vast volumes of data helps in the easy identification of suspicious patterns indicative of fraudulent activities. This aids in preventing monetary losses and maintaining security.
Helps in better understanding of customer behavior:
Data analysis helps find customer behavior patterns and preferences, allowing businesses to use their products, services, and marketing strategies accordingly.
Getting to know the future trends:
With advanced analytics techniques such as predictive modeling or machine learning algorithms, organizations gain the ability to forecast future trends accurately. This helps them to adapt proactively to changing requirements and evolving market needs.
Data-driven decision-making helps in overall success:
Data analysis helps to make informed decisions based on some evidence which reduces guesswork and enables more accurate predictions.
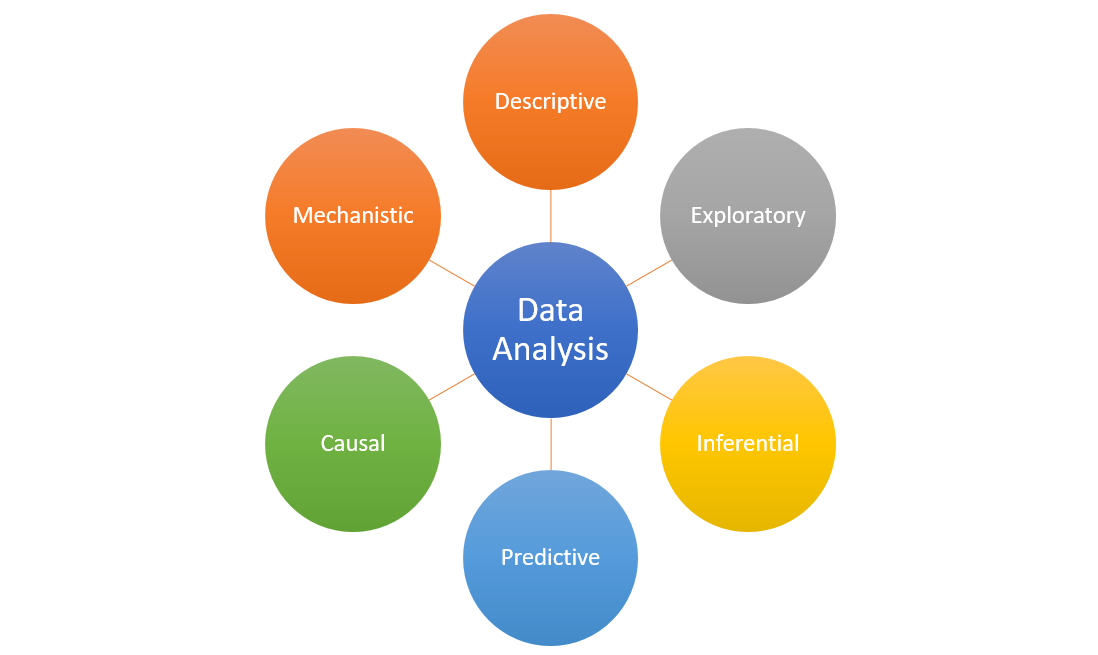
Types of Data Analysis
There are four main types of data analysis namely Descriptive Analysis, Diagnostic analysis, predictive analysis, and prescriptive analysis. Let us discuss each one of them in detail.
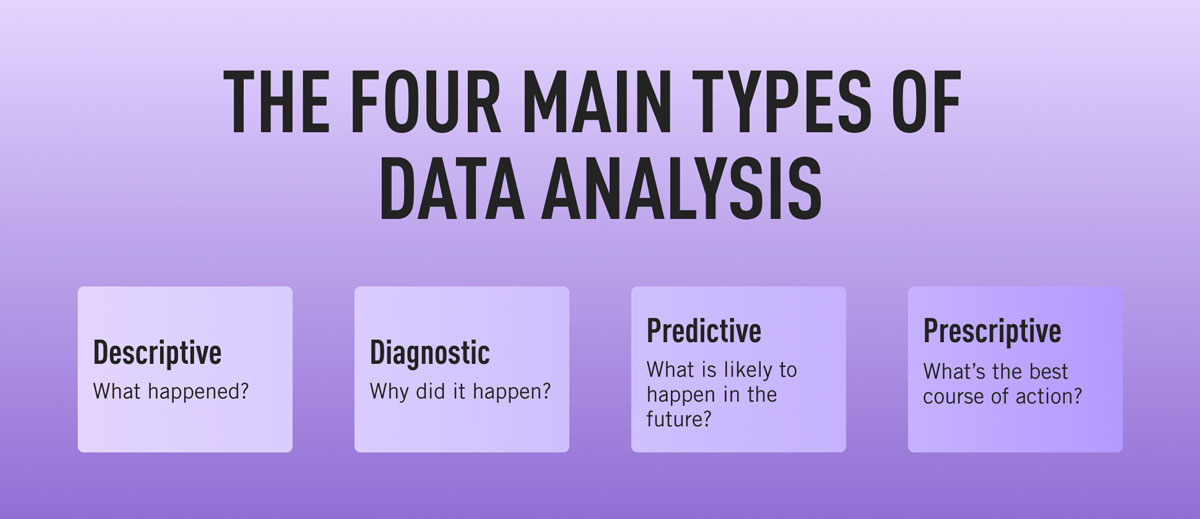
1. Descriptive Analysis:
In simple words, descriptive analysis provides a snapshot of what has happened in the past. Performing descriptive analytics enables us to gain an understanding of historical trends as it serves as a foundation for further exploration and decision-making processes.
It focuses on answering questions like "What happened?" or "What are the key characteristics of our product?" Some of the day-to-day use cases of descriptive analysis are mentioned below:
Use Cases:
1. Improving business performance by tracking older patterns:
Descriptive analytics plays a vital role in evaluating business performance. By analyzing sales figures, revenue outcomes, and customer behavior patterns, over a specific period, organizations can identify areas of improvement within their operation.
2. Risk Assessment and Fraud Detection:
By analyzing historical data, organizations can identify anomalies, outliers, or suspicious activities that may indicate potential fraud attempts. Descriptive analytics helps to detect fraudulent transactions and protect customers from unauthorized activities.
3. Supply Chain Optimization:
Descriptive analytics allows businesses to gain insights into the supply chain process by examining historical data related to inventory levels, transportation routes, or the performance of stores. This information empowers organizations to optimize their supply chain operations and streamline logistics processes.
2. Diagnostic Analysis:
Diagnostic analysis digs deeper into identifying the root causes behind certain phenomena or outcomes. It focuses on answering "why" questions by examining relationships between different variables and utilizing advanced statistical tools like regression analysis or hypothesis testing. Diagnostic analysis helps organizations understand why specific events occurred and facilitate problem-solving strategies accordingly.
Diagnostic analytics aims to answer questions such as "Why did this happen?", "What caused this outcome?" Some of the day-to-day use cases of diagnostic analysis are mentioned below:
Use Cases
1. Identifying Underperforming Sales Domains:
A company with diverse sales domains can utilize diagnostic analytics to understand why certain regions are underperforming compared to others. By examining various factors businesses can identify specific issues hindering sales performance such as targeted marketing efforts to improve performance.
2. Identifying Customer Churn Patterns:
With diagnostic analytics, businesses can analyze customer behavior data along with other relevant variables like service quality ratings, product usage patterns, or competitor activities. By identifying key drivers leading to poor customer support experience, companies can proactively address those issues and implement strategies accordingly.
Predictive Analysis:
Predictive analysis focuses on forecasting future events based on historical data patterns and trends. Using various machine learning algorithms and statistical modeling techniques, predictive analytics allows businesses to make well-informed predictions about customer behavior, and market trends. Some of the day-to-day use cases of predictive analysis are mentioned below:
Use cases
1. Healthcare Industry:
By analyzing patient data such as medical history, and genetic information, healthcare providers can identify individuals at high risk for certain diseases or conditions. This empowers them to intervene early, personalize treatments, and ultimately save lives. Predictive models can even aid in predicting disease outbreaks or identifying patterns that may indicate an epidemic outbreak before it occurs.
2. Retail Sector:
In the retail sector, predictive analytics is used to predict consumer behavior accurately and stay ahead of trends. By understanding historical purchasing patterns and demographic information, retailers can create personalized recommendations for customers to improve customer satisfaction. Predictive analytics can also help to optimize inventory management by forecasting demand trends accurately ensuring product availability.
3. Fraud Detection especially in Financial Services:
The financial industry heavily relies on predictive analytics to mitigate risks associated with fraud detection and credit assessment. By combining historical transactional data with real-time monitoring systems, banks can identify suspicious activities promptly and prevent fraudulent transactions.
4. Prescriptive Analysis:
Prescriptive analysis offers recommendations on how to achieve the best-desired outcomes by simulating different scenarios. By combining historical data, predictive modeling, and optimization techniques, prescriptive analytics empowers organizations to understand what will happen in the future and determine the best course of action to achieve desired outcomes. Some of the day-to-day use cases of diagnostic analysis are mentioned below:
Use cases
1. Healthcare Resource Allocation:
In the healthcare industry, prescriptive analytics plays a vital role in optimizing resource allocation for hospitals and clinics. By analyzing patient demographics, disease patterns, treatment effectiveness rates, and available resources, healthcare providers can make informed decisions on staffing levels, facility expansion requirements, and equipment needs.
2. Energy Management:
By integrating real-time data from smart grids, weather forecasts, and energy demand patterns, prescriptive analytics help companies identify the most efficient methods of energy production, distribution, and storage enabling them to minimize waste, reduce carbon footprints, and ensure a reliable supply of energy.
Conclusion:
From descriptive analysis providing an overview of past trends to predictive and prescriptive analysis offering valuable insights for future decisions, each approach plays a vital role in unlocking the potential hidden within raw data. Understanding types of data analysis arms businesses with the knowledge necessary to leverage information effectively, drive innovation, and gain a competitive edge in today's data-driven world.
To make the process of data analysis easy leveraging some tools and technologies can help you and your organization to stay one step ahead of your competition. One such data analysis tool isSprinkle Data which not only helps in data storing, collection, and management but also has some powerful reporting capabilities with numerous charts that cater to different needs.
Frequently Asked Questions FAQs - Types of data analysis
What are the 3 C's of data analytics?
The three C's of data analytics are context, content, and community. Context refers to understanding the background in which the data is collected or analyzed. Content refers to the data being analyzed part and community refers to the collaboration and communication between different stakeholders involved in the data analytics process.
What are the three 3 methods of collecting data?
The three methods of collecting data are surveys, interviews, and observations. Surveys involve asking a set of questions to a group. Interviews involve having direct conversations with individuals or groups to gain deeper insights into their thoughts or behaviors. Observations involve systematically observing and recording behavior or events in real time.
What are the 3 major phases of data analytics describe each.
The three major phases of data analytics are data preparation, analysis, and interpretation. Data is cleaned, transformed, and prepared for analysis in the first phase by removing inconsistencies or errors. In the second phase, various statistical techniques are applied to extract meaningful patterns or insights from the data. In the final phase, these findings are communicated using visualizations or reports for better understanding and decision-making.
What are the different types of data?
Data can be classified into different types such as qualitative data and quantitative data. Its further classification contains categorical/ordinal data, time-series data, spatial/geographic data, etc.
What are the 3 common methods used to collect qualitative data?
The three common methods used to collect qualitative data are interviews, focus groups, and observations. Interviews involve having in-depth conversations with individuals. Focus groups involve bringing together a small group of people with similar characteristics or interests to discuss a specific topic. Observations involve systematically watching and recording behaviors.
What are the 5 characteristics of big data?
The five characteristics of big data are volume, velocity, variety, veracity, and value.
What are the types of big data?
There are four types of big data: structured data, unstructured data, semi-structured data, and metadata.
What is the role of a data analyst?
The role of a data analyst is to collect, clean, interpret, and analyze data, to identify patterns, trends, and insights that can help organizations make informed decisions.
Is AI part of data science?
AI (Artificial Intelligence) is considered part of data science because it involves using algorithms and computational models to mimic human intelligence and automate tasks based on large volumes of data.
What is the data analysis technique?
Data analysis techniques refer to analyzing data using various methods and approaches. These techniques can include statistical analysis, machine learning algorithms, visualization tools, etc., depending on the objective


