


In today's fast-paced business world, companies must track their performance and progress using specific measurements, known as business metrics. These metrics provide valuable insights into the health of a business and help decision-makers make informed choices to drive growth and success.
What are Business Metrics?

Business metrics are quantifiable measures that organizations use to gauge various aspects of their operations, such as sales, marketing, finance, customer service, and more. By tracking these key performance indicators (KPIs), businesses can identify areas of improvement, set goals, and monitor their progress over time.
Importance of analyzing and tracking business metrics
In today's competitive business environment, tracking and analyzing key metrics is essential for the success of any company. Here are some reasons why tracking and analyzing business metrics is crucial:
Performance evaluation:
Metrics allow you to measure the performance of your business against predefined goals and benchmarks. By regularly reviewing these metrics, you can easily identify whether your business is on track or if adjustments need to be made.
Identify trends:
Tracking metrics over time allows you to spot trends in your business processes. This information can help you predict future outcomes and make strategic decisions accordingly.
Improve decision-making:
Analyzing data-driven insights helps you make informed decisions about resource allocation, marketing strategies, product development, and more. This can lead to improved efficiency and effectiveness in running your business.
Monitor financial health:
Key financial metrics such as revenue, expenses, profit margins, and cash flow are critical for assessing the financial health of your business. By closely monitoring these metrics, you can ensure that your business remains financially stable and sustainable.
Measure customer satisfaction:
Metrics related to customer feedback, retention rates, and Net Promoter Score (NPS) provide valuable insights into how satisfied your customers are with your products or services. Understanding customer sentiment can help you improve customer experiences and loyalty.
Track operational efficiency:
Monitoring metrics related to production processes, inventory management, supply chain logistics, and employee productivity can help you identify bottlenecks or inefficiencies in your operations. This insight enables you to streamline processes and reduce costs.
Stay ahead of competitors:
By tracking industry benchmarks and comparing your performance against competitors, you can identify areas where you excel or lag behind the competition. This knowledge allows you to capitalize on strengths and address weaknesses proactively.
Set goals and objectives:
Establishing clear goals based on measurable metrics provides a roadmap for achieving success in your business. Regularly reviewing progress towards these goals helps keep employees motivated and focused on achieving desired outcomes.
Types of Business Metrics
1. Financial Metrics:

These metrics focus on the financial health and performance of a company. Examples include revenue, profit margin, cash flow, return on investment (ROI), and gross margin. Financial metrics are essential for assessing the overall profitability and sustainability of a business.
Financial metrics are essential tools for businesses to track and analyze their financial performance. These metrics provide valuable insights into the health and stability of a company, helping managers make informed decisions and plan for the future.
There are various types of financial metrics that businesses use to evaluate their financial performance. Some common examples include:
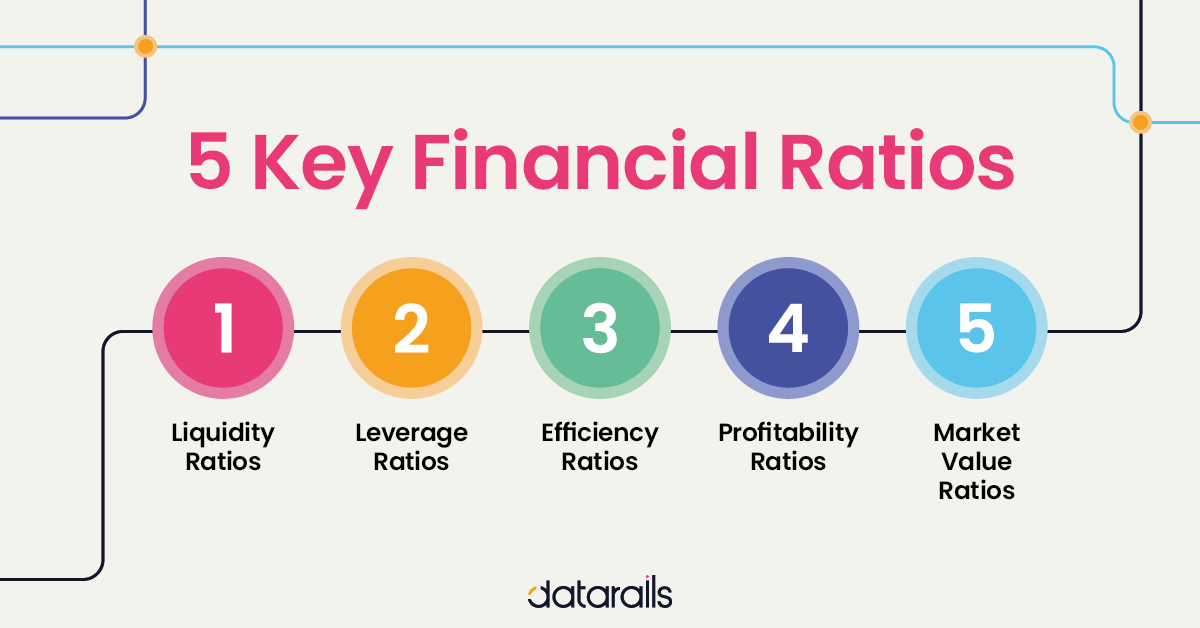
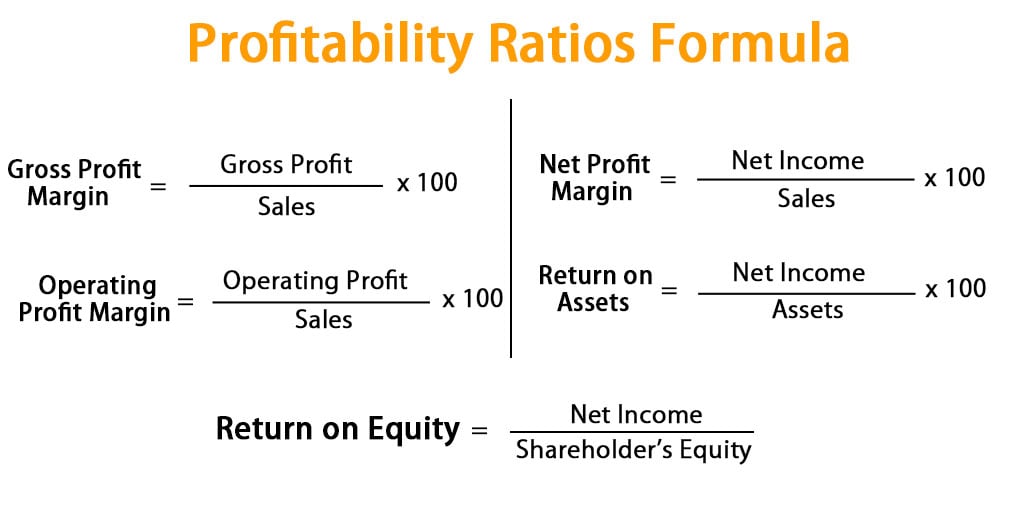
1. Profitability ratios:

Profitability ratios measure a company's ability to generate profit relative to its revenue or assets. Examples of profitability ratios include gross profit margin, net profit margin, return on assets, and return on equity.
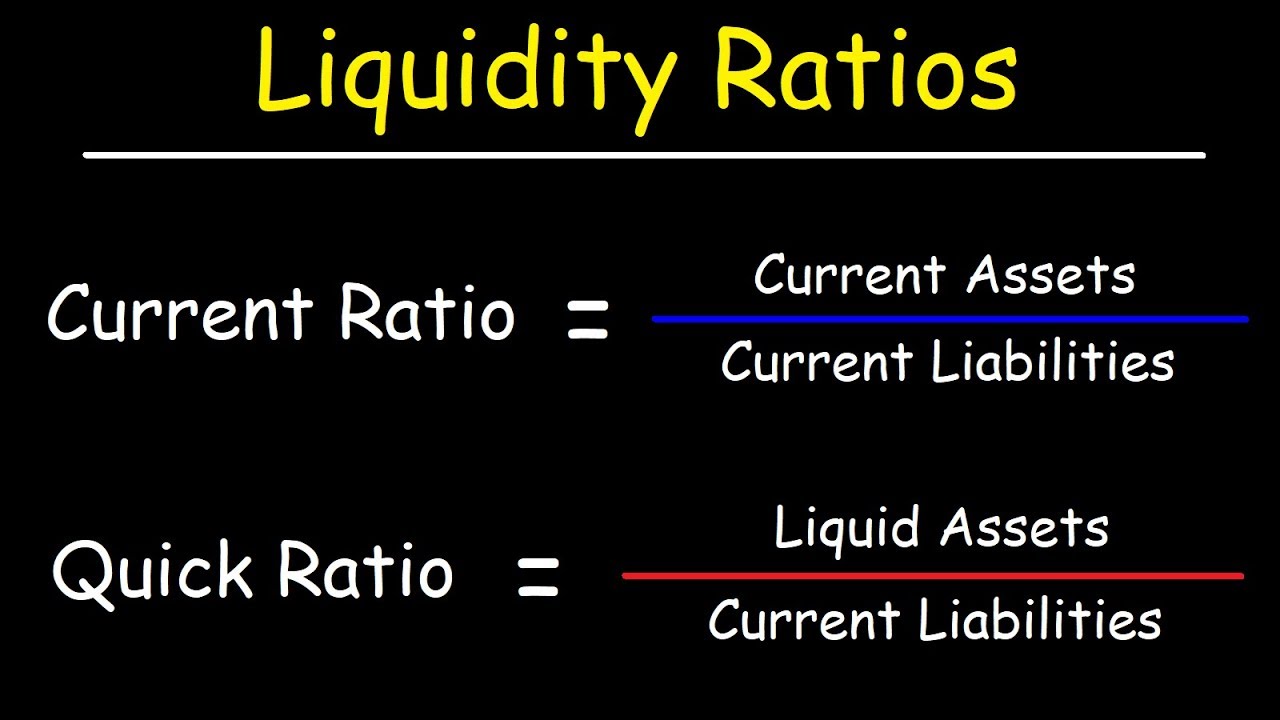
2. Liquidity ratios:

Liquidity ratios assess a company's ability to meet its short-term obligations with its current assets. Examples of liquidity ratios include the current ratio and quick ratio.
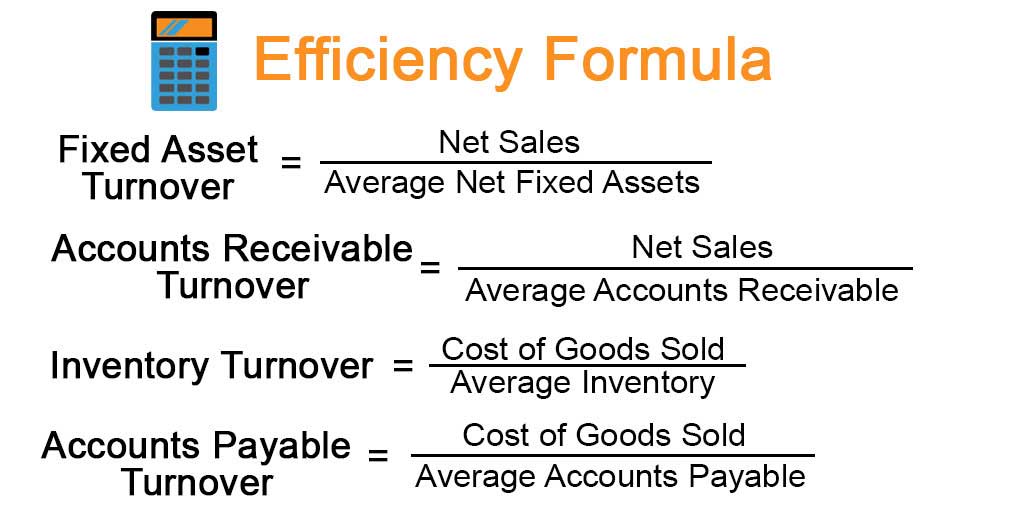
3. Efficiency ratios:

Efficiency ratios measure how effectively a company is utilizing its resources to generate revenue. Examples of efficiency ratios include asset turnover, inventory turnover, and accounts receivable turnover.
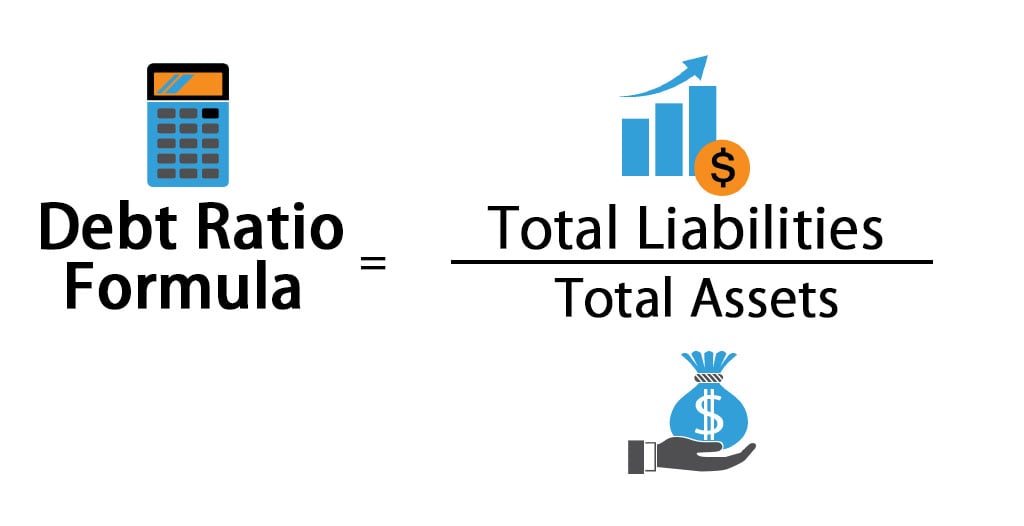
4. Debt ratios:

Debt ratios evaluate a company's debt levels and its ability to repay its debts. Examples of debt ratios include debt-to-equity ratio, interest coverage ratio, and debt-to-asset ratio.
5. Growth metrics:
Growth metrics track a company's growth over time in terms of revenue, profits, market share, or customer base. Common growth metrics include year-over-year revenue growth and customer acquisition rate.
In addition to using financial metrics internally, companies may also use them to communicate their financial performance to external stakeholders such as investors, lenders, suppliers, and customers.
2. Customer Metrics:

Customer metrics are essential for businesses to measure and analyze customer behavior, satisfaction, and loyalty. By tracking these metrics, companies can make informed decisions and improvements to their products and services. Some types of customer metrics to track are:
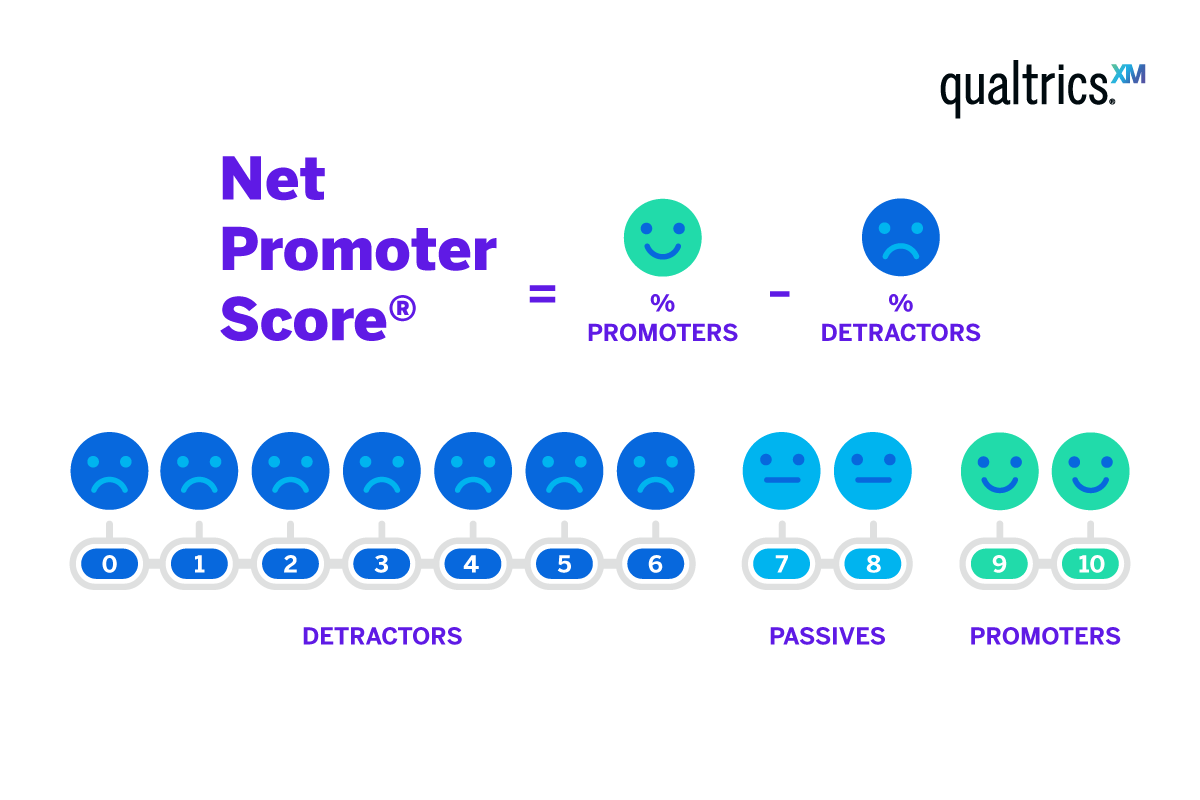
Net Promoter Score (NPS):

NPS is a key customer metric that measures the likelihood of customers recommending a company to others. It is calculated based on a simple survey question asking customers how likely they are to recommend the company on a scale of 0-10. Customers who score 9-10 are considered promoters, while those who score 0-6 are detractors. The NPS is calculated by subtracting the percentage of detractors from the percentage of promoters.
Customer Satisfaction Score (CSAT):

CSAT measures customer satisfaction with a product or service after an interaction with the company. It is typically measured through surveys asking customers to rate their satisfaction on a scale from 1-5 or 1-10. Companies can use this metric to identify areas for improvement and ensure customer satisfaction.
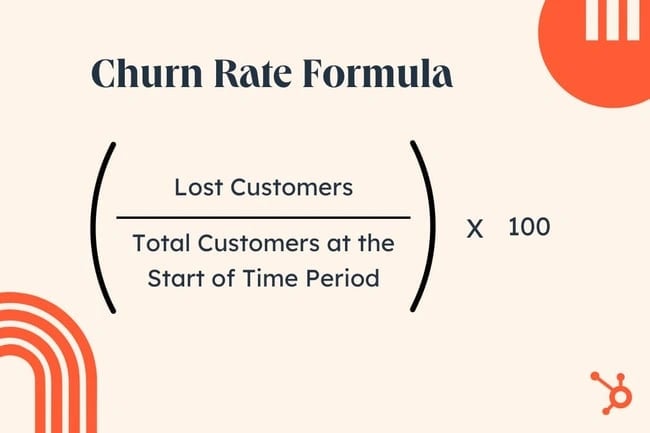
Customer Churn Rate:

Customer churn rate measures the percentage of customers who stop using a company's product or service over a specific period. High churn rates indicate dissatisfaction among customers or issues with the product/service. By tracking this metric, companies can take proactive steps to retain customers and reduce churn.
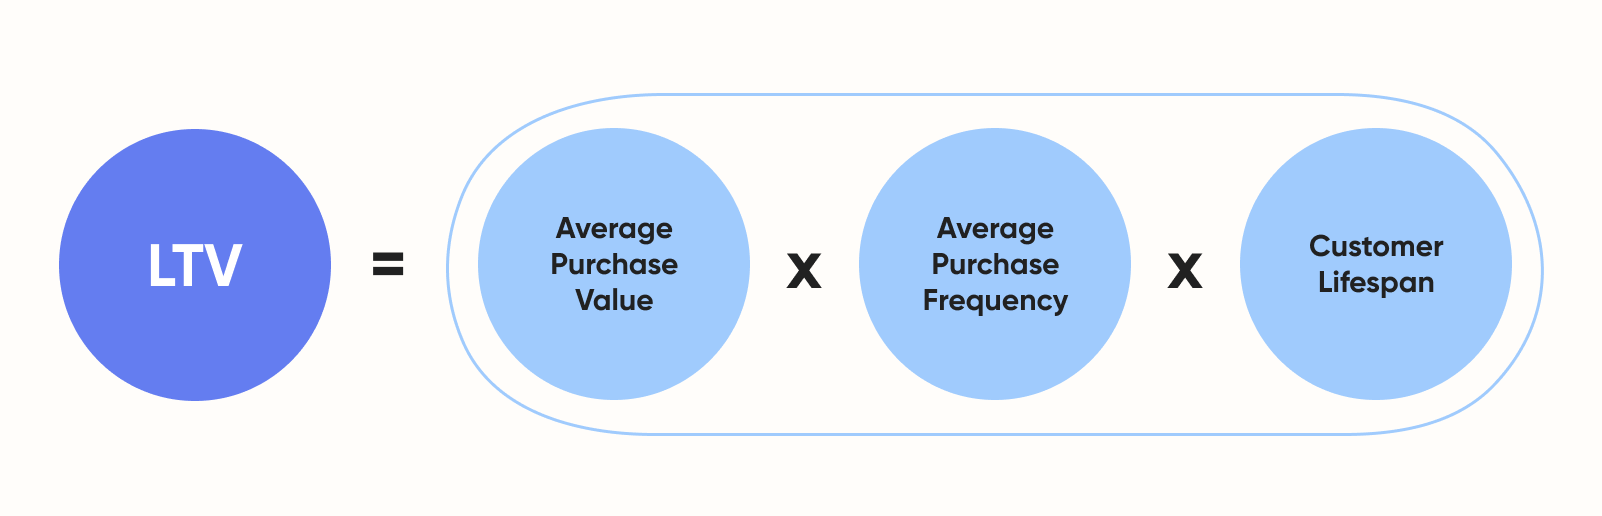
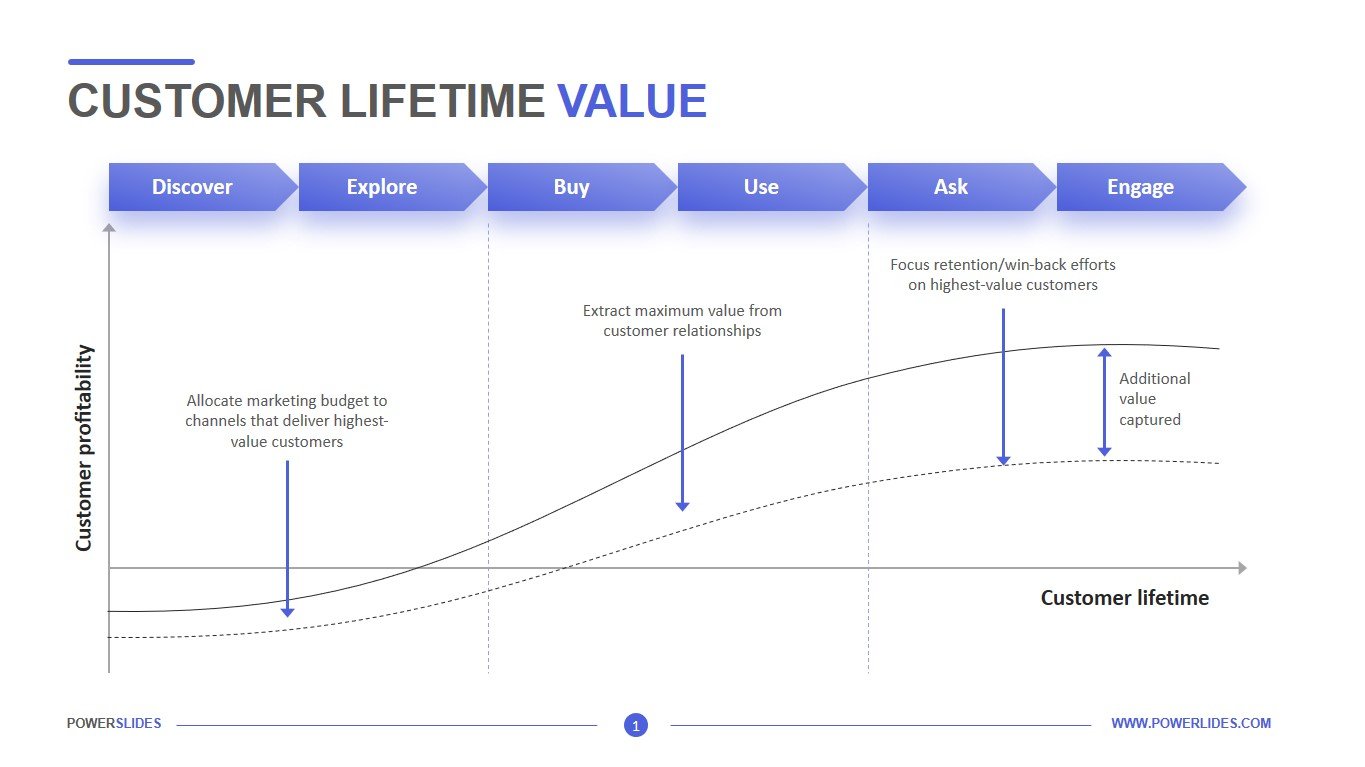
Customer Lifetime Value (CLV):

CLV is a predictive metric that calculates the total revenue expected from a customer throughout their relationship with the company. By understanding the CLV of different customer segments, companies can tailor their marketing strategies, retention efforts, and customer service initiatives accordingly.
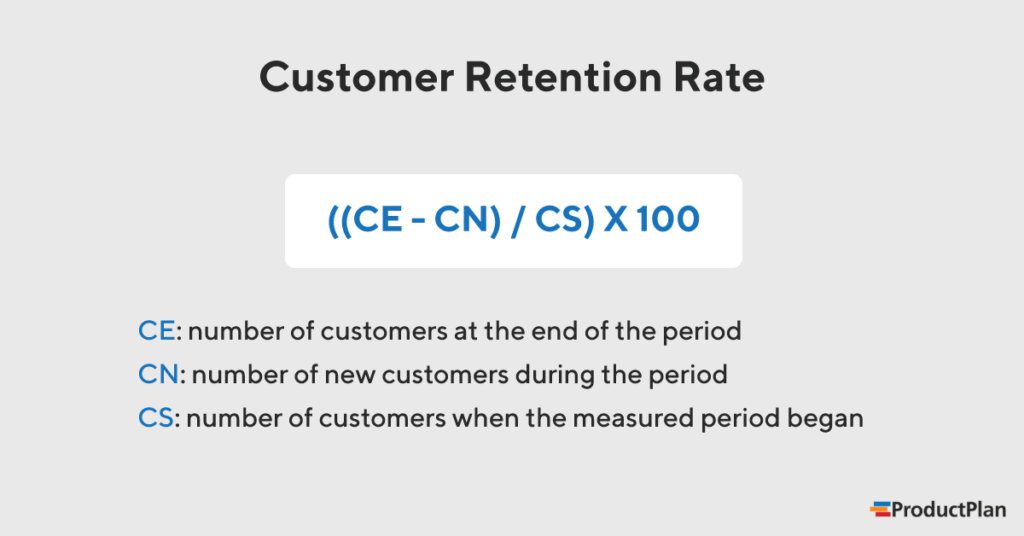
Customer Retention Rate:

Customer retention rate measures the percentage of customers who continue to use a company's product or service over time. High retention rates signal satisfied customers and strong relationships with the brand. By focusing on retaining existing customers, companies can drive long-term growth and profitability.
By tracking metrics such as NPS, CSAT, churn rate, CLV, and retention rate, companies can gain valuable insights into customer preferences, behaviors, and satisfaction levels.
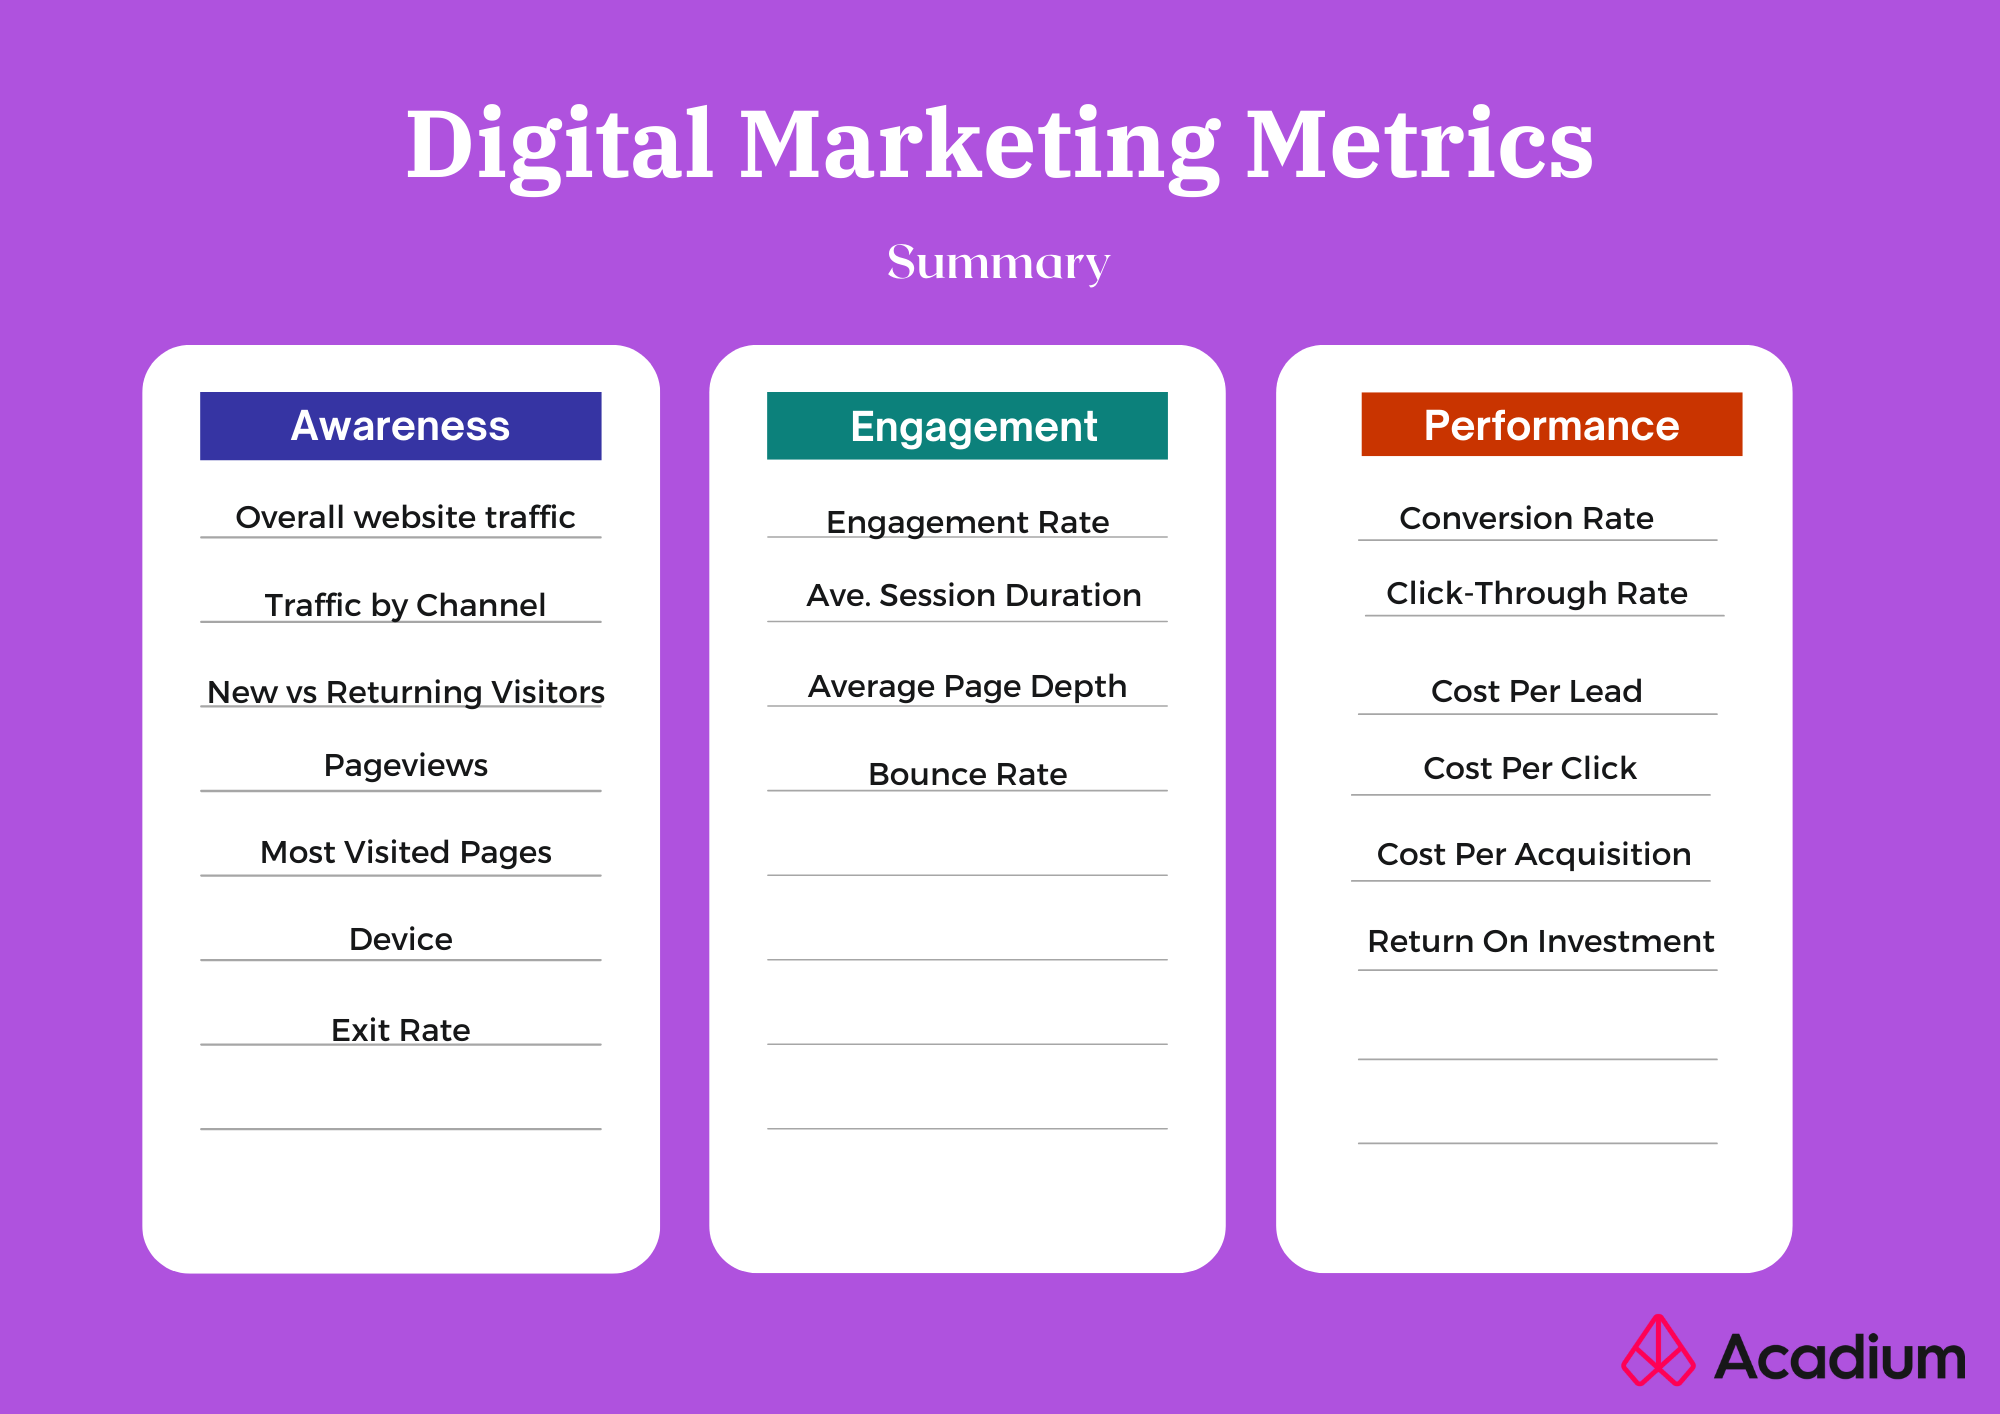
3. Marketing Metrics:

Marketing metrics track the performance of marketing campaigns and initiatives. Some key marketing metrics include website traffic, conversion rate, click-through rate (CTR), cost per lead (CPL), and social media engagement.
Website Traffic:
Monitor the number of visitors to your website, as well as where they are coming from (organic search, social media, paid advertising, etc.). This metric can help you understand which channels are driving the most traffic and adjust your efforts accordingly.
Conversion Rate:

Track the percentage of website visitors who take a desired action, such as making a purchase or signing up for a newsletter. A high conversion rate indicates that your website is effectively converting visitors into customers.
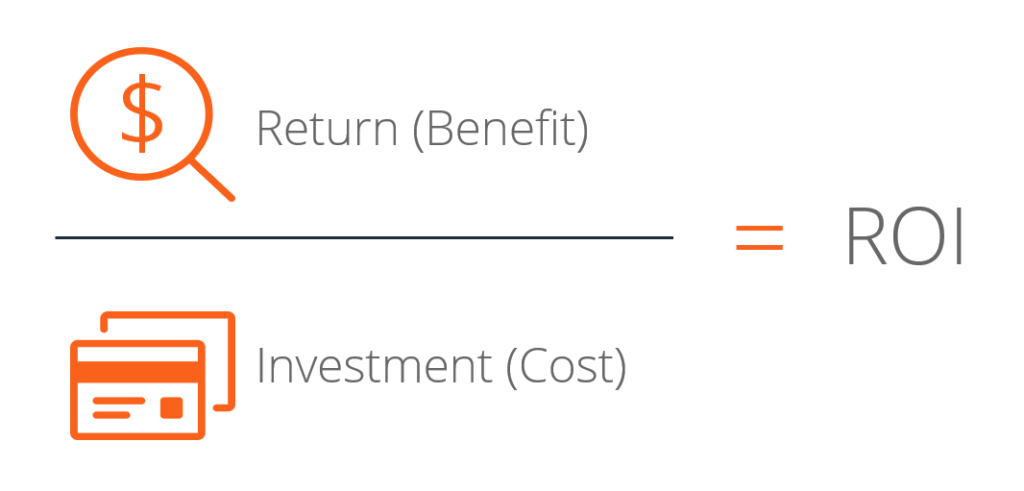
Return on Investment (ROI):

Calculate the return on investment for each marketing campaign by comparing the cost of the campaign to the revenue generated. This metric can help you determine which campaigns are delivering the best results and allocate resources accordingly.
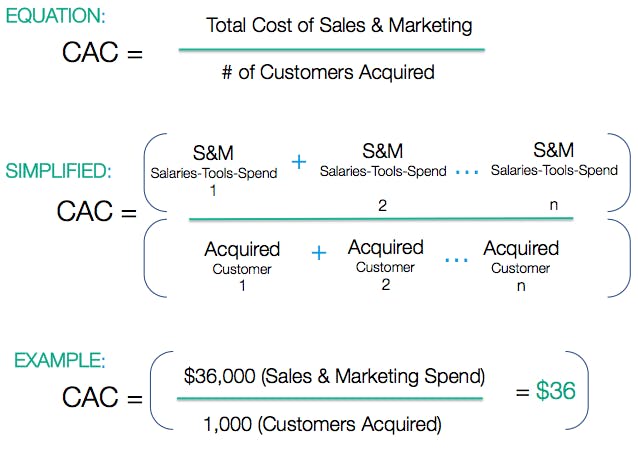
Customer Acquisition Cost (CAC):

Determine how much it costs to acquire a new customer by dividing your total marketing expenses by the number of new customers acquired during a specific period. Keeping CAC low is important for maximizing profitability.
Customer Lifetime Value (CLV):

Estimate the value of a customer over their entire relationship with your business. CLV helps you understand how much revenue you can expect to generate from each customer and tailor your marketing efforts accordingly.
Email Open and Click-through Rates:
Measure how many recipients open your emails and click on links within them. These metrics can help you assess the effectiveness of your email campaigns and refine your messaging to improve engagement.
Social Media Engagement:
Monitor likes, comments, shares, and other interactions on social media platforms to gauge audience engagement with your content. High levels of engagement indicate that your content is resonating with your target audience.
Brand Awareness:
Track metrics such as brand mentions, search volume for branded terms, and social media followers to measure awareness of your brand among consumers. Increasing brand awareness can lead to higher levels of trust and loyalty among customers.
Customer Satisfaction:
Use surveys or feedback forms to measure customer satisfaction with your products or services. Happy customers are more likely to become repeat buyers and advocates for your brand.
Marketing Qualified Leads (MQLs) vs Sales Qualified Leads (SQLs):
Differentiate between leads that have shown interest in your product or service through marketing activities (MQLs) and those that are ready to be passed on to sales (SQLs). Understanding this distinction can help streamline the sales process and improve conversion rates.
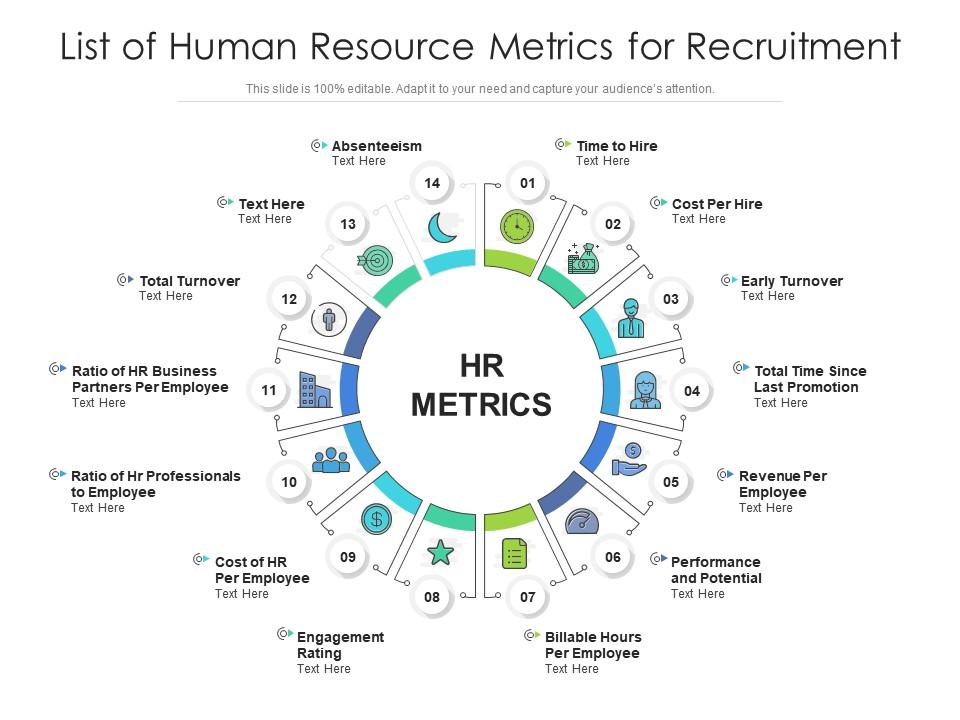
4. Human Resources Metrics:

Human resources metrics focus on employee performance, satisfaction, retention, and development. Examples include employee turnover rate, absenteeism rate, training hours per employee, and job satisfaction score. These metrics help companies measure the effectiveness of their HR practices and create a positive work environment for employees.
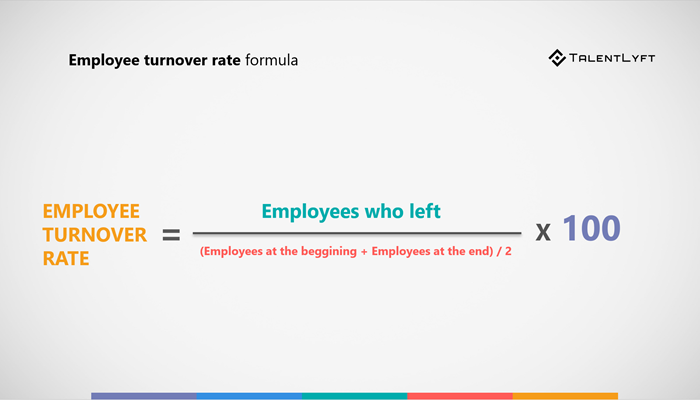
Employee turnover rate:

This metric measures the number of employees who leave the organization within a specific period. A high turnover rate can indicate issues such as poor employee engagement, lack of career development opportunities, or ineffective leadership.
Time to fill:
This metric tracks the amount of time it takes to fill a vacant position. A long time to fill can result in increased costs and productivity losses for the organization.
Cost per hire:
This metric calculates the total cost incurred to hire a new employee. Tracking this metric helps organizations understand their recruitment expenses and identify ways to optimize their hiring process.
Absenteeism rate:
This metric measures the average number of days employees are absent from work due to illness or other reasons. High absenteeism rates can impact productivity and morale within the organization.
Training and development investment:
This metric measures the amount of resources allocated towards training and development programs for employees. Investing in employee development can lead to increased retention rates and improved performance.
Diversity and inclusion metrics:
These metrics track the representation of diverse groups within the organization, such as gender, race, age, and ethnicity. Monitoring diversity and inclusion metrics helps organizations create a more inclusive workplace culture.
Performance ratings:
Tracking employee performance ratings can help identify top performers, as well as underperforming employees who may require additional support or intervention.
Employee satisfaction surveys:
Regularly conducting employee satisfaction surveys can provide valuable insights into employee engagement levels, job satisfaction, and overall organizational culture.
HR budget vs actual spending:
Monitoring HR budget vs actual spending helps organizations ensure they are operating within budget constraints while still meeting their strategic objectives.
Revenue per employee:
This metric calculates how much revenue each employee generates for the organization on average. Tracking revenue per employee can help organizations assess workforce productivity and efficiency.
5. Sales Metrics:

Sales metrics track the performance of sales teams in meeting revenue targets and closing deals. Examples include sales conversion rate, average deal size, pipeline coverage ratio, sales velocity, and win-loss ratio.
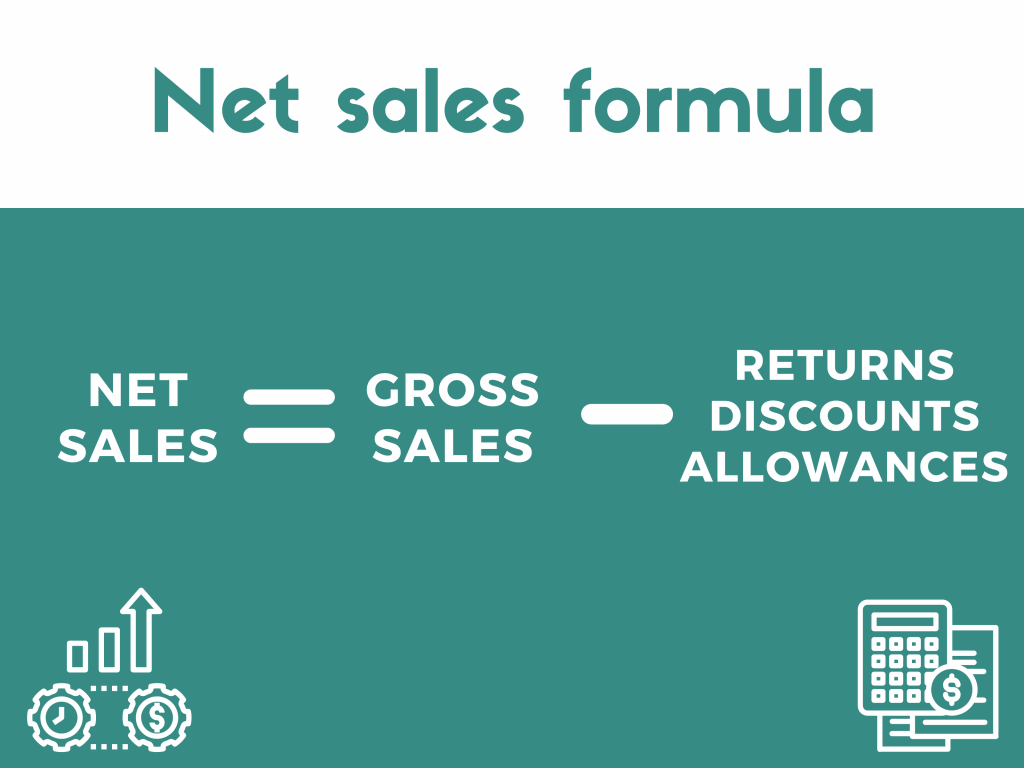
Net Sales Revenue:

This is perhaps the most basic metric to track, but also one of the most important. Sales revenue refers to the total amount of money generated from sales within a specific period. Tracking sales revenue can help businesses understand how well their products or services are selling and whether they are meeting their revenue goals.
Conversion Rate:
The conversion rate measures the percentage of leads that turn into customers. A high conversion rate indicates that a sales team is effectively closing deals, while a low conversion rate may indicate that there are issues in the sales process that need to be addressed.
Average Deal Size:

This metric calculates the average value of each deal closed by your sales team. Monitoring this metric can help businesses understand which products or services are driving the most revenue and where there may be opportunities to upsell or cross-sell.
Sales Cycle Length:
The sales cycle length measures the amount of time it takes for a lead to progress through the sales process and become a customer. Analyzing this metric can help businesses identify bottlenecks in their sales process and make adjustments to improve efficiency.
Customer Acquisition Cost (CAC):
CAC measures how much it costs to acquire a new customer. Calculating this metric involves adding up all marketing and sales expenses and dividing by the number of new customers acquired during a specific period. Keeping CAC low is essential for maximizing profitability.
Customer Churn Rate:
Customer churn rate measures the percentage of customers who stop using your product or service over a given period. High churn rates can indicate issues with product quality, customer service, or pricing that need to be addressed.
Pipeline Velocity:
Pipeline velocity measures how quickly leads move through the sales pipeline from initial contact to close. Monitoring pipeline velocity can help businesses identify areas where deals tend to get stuck and make adjustments to keep prospects moving through the funnel.
How to Measure and Analyze Business Metrics
In today's fast-paced business world, companies must have a deep understanding of their performance and progress. This requires measuring and analyzing various business metrics effectively to make informed decisions and drive growth. Business Intelligence (BI) tools can help organizations streamline this process by providing valuable insights through data visualization and analytics.
1. Define Key Performance Indicators (KPIs):
The first step in measuring business metrics is to identify the most important KPIs that align with your company's goals and objectives. These could include revenue, customer acquisition costs, conversion rates, employee productivity, etc. By focusing on these core indicators, you can track your progress more effectively.
2. Collect Relevant Data:
Once you have identified your KPIs, it is essential to gather relevant data from various sources such as CRM systems, financial records, social media platforms, etc. This data will provide the foundation for your analysis and decision-making processes.
3. Choose the Right BI Tools:
There are numerous BI tools available in the market that can help you visualize and analyze your data effectively. Some popular options include Sprinkle Data, Tableau, Power BI, QlikView, etc. It is important to choose a tool that suits your organization's needs and budget.
4. Create Dashboards and Reports:
Utilize your chosen BI tool to create interactive dashboards and reports that showcase your KPIs in an easily digestible format. These visualizations can help stakeholders across the organization understand performance trends and make data-driven decisions.
5. Analyze Trends and Patterns:
Use your BI tool to dive deeper into the data and uncover trends or patterns that may impact your business performance. For example, analyzing customer behavior or market trends can help you fine-tune your strategies for better results.
6. Set Targets and Monitor Progress:
Establish realistic targets based on your KPIs and regularly monitor progress towards achieving them. Adjusting strategies or tactics as needed will ensure that you stay on track toward meeting your business objectives.
7. Continuously Improve:
Business metrics should not be set in stone - they should evolve as your company grows and changes. Regularly review your KPIs and update them as necessary to reflect new priorities or challenges.
Conclusion
Sprinkle Data offers a comprehensive platform that allows companies to easily collect, analyze, and visualize their data in real-time. With customizable dashboards and advanced analytics capabilities, Sprinkle Data enables businesses to gain valuable insights into their performance and make data-driven decisions that drive growth and success. Whether it's monitoring sales figures, tracking customer retention rates, or measuring marketing ROI, using Sprinkle Data can help businesses stay ahead of the curve and achieve their objectives efficiently.
Frequently Asked Questions FAQs - Business Metrics
What are the 5 key business metrics?
The five key business metrics are revenue, profit margin, customer acquisition cost, customer lifetime value, and return on investment. Revenue measures the total amount of money a company brings in from its products or services. Profit margin is the percentage of revenue that remains after deducting all expenses. Customer acquisition cost calculates how much it costs to acquire a new customer. Customer lifetime value quantifies the total revenue a company can expect from a single customer over their entire relationship. Return on investment measures the profitability of an investment relative to its cost.
What are the 4 main metrics?
The four main metrics are financial, operational, marketing, and sales.
- Financial metrics include revenue growth rate, profit margin, and cash flow.
- Operational metrics focus on efficiency and productivity within operations such as inventory turnover and production cycle time.
- Marketing metrics measure the effectiveness of marketing efforts like conversion rate and cost per lead.
- Sales metrics track sales performance indicators such as monthly sales growth and average deal size.
What are metrics and examples?
Metrics refer to quantifiable measurements used to track progress towards specific goals or objectives within a business. Examples of metrics include net promoter score (NPS) which measures customer loyalty and satisfaction, and website traffic which tracks the number of visitors to a site.
What are business metrics and KPIs?
Business metrics are Key Performance Indicators (KPIs) that help organizations evaluate their success in reaching strategic objectives. KPIs are specific measurements that reflect the critical success factors of a business strategy or operation. They provide insight into how well a company is performing against its goals by highlighting areas for improvement or identifying strengths to leverage.
What is the difference between KPI and metrics?
The difference between KPIs and metrics lies in their purpose and scope - while all KPIs are metrics, not all metrics are KPIs. KPIs are selected from relevant metrics based on their ability to directly impact organizational performance and align with strategic objectives. Metrics provide data-driven insights into various aspects of business operations but may not always be tied directly to key performance indicators.
Is metrics a KPI?
Yes, some metrics can also be considered KPIs if they are specifically chosen to monitor key areas of performance that align with strategic goals or objectives. For example, if customer satisfaction is a critical factor for a company's success, then NPS can serve as both a metric and a KPI.
Why are metrics and KPIs important for my business?
KPIs and business metrics are important for businesses because they provide clear benchmarks for measuring progress toward achieving organizational goals. They help identify areas where improvements can be made by providing actionable insights based on data analysis.
How do you write KPI metrics?
To write KPI metrics you need to first identify your organization's key goals or objectives. Then determine what indicators will best measure progress towards those goals. Finally, establish targets for each indicator to gauge success.
How KPI is calculated?
KPI is calculated by dividing the actual value achieved by the target value set for that particular metric. This calculation results in a percentage indicating how close an organization is to achieving its goal.
What are key metrics in a business plan?
Key metrics in a business plan typically include financial metrics such as gross revenue, cost of goods sold, and net profit. Other important metrics could relate to market share, growth projections, and customer retention rates.
How do I choose and track business metrics?
Choosing appropriate business metrics involves understanding your organization's overall strategy, determining what areas need improvement, and selecting metrics that align closely with these priorities. It's important to choose metrics that can be easily measured, relevant, and impactful.
How do you create business metrics for running a successful business?
Creating effective business metrics involves setting clear objectives, tailoring them to your organization's unique needs, focusing on measurable outcomes, and regularly reviewing performance against these targets.


