


With the explosion of data being generated every day, businesses are increasingly turning to analytics tools to make sense of this vast amount of information and derive valuable insights from it for strategic decision-making processes.
BI tools play a crucial role in this process by allowing companies to visualize and analyze complex data sets, identify trends and patterns, and make informed decisions based on actionable insights.
What is Excel?
Excel is a powerful spreadsheet program developed by Microsoft that allows users to organize, analyze, and visualize data in a user-friendly format. It is widely used for various tasks such as creating budgets, tracking expenditures, managing stock, etc by businesses, and students.
What is Power BI?

Power BI is a powerful business intelligence tool developed by Microsoft that allows users to visualize and analyze their data and create reports in a user-friendly and interactive way.
Power BI Vs Excel: Key Differences

1. Power BI vs Excel: Data connectivity
Data connectivity is crucial to any data analysis tool, as it allows users to connect and retrieve data from various data sources.
Excel:

Excel offers basic data connectivity features that allow users to import data from various sources such as databases, CSV files, and web services.
Users can also use Excel's built-in functions and formulas to manipulate and analyze the imported data to perform calculations. While Excel provides flexibility in importing data, it may not be suitable for handling large datasets or performing complex data transformations.
Power BI

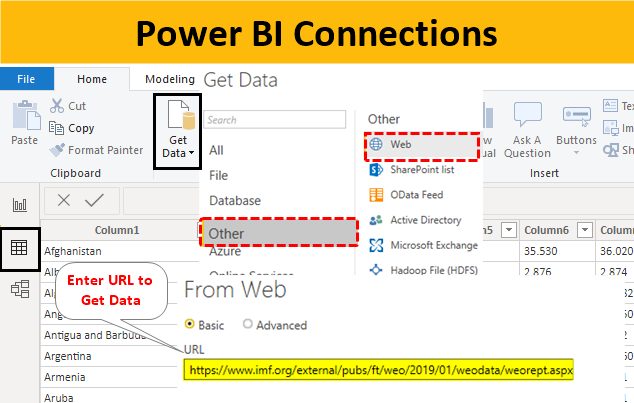
Power BI is a business intelligence tool specifically designed for exploring and visualizing large amounts of data. Power BI offers more advanced data connectivity capabilities than Excel, allowing users to connect to a wider range of sources including cloud services like Azure SQL Database, Google Analytics, Salesforce, and more.
Power BI also provides features such as Dataflows and DirectQuery that enable real-time access to data without importing it into the tool.
2. Power BI vs Excel: User interface
Excel

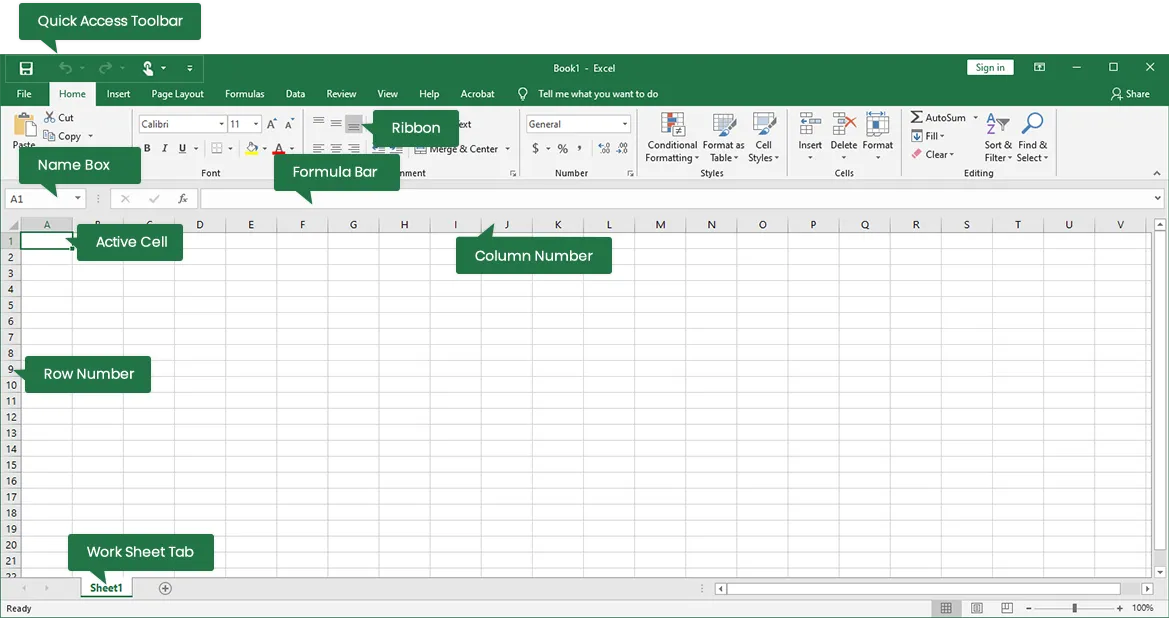
Excel is a familiar tool for many people, as it is widely used in businesses for various tasks such as creating spreadsheets, charts, and graphs. The user interface of Excel is relatively intuitive, with menus and functions that are easy to navigate.
Power BI

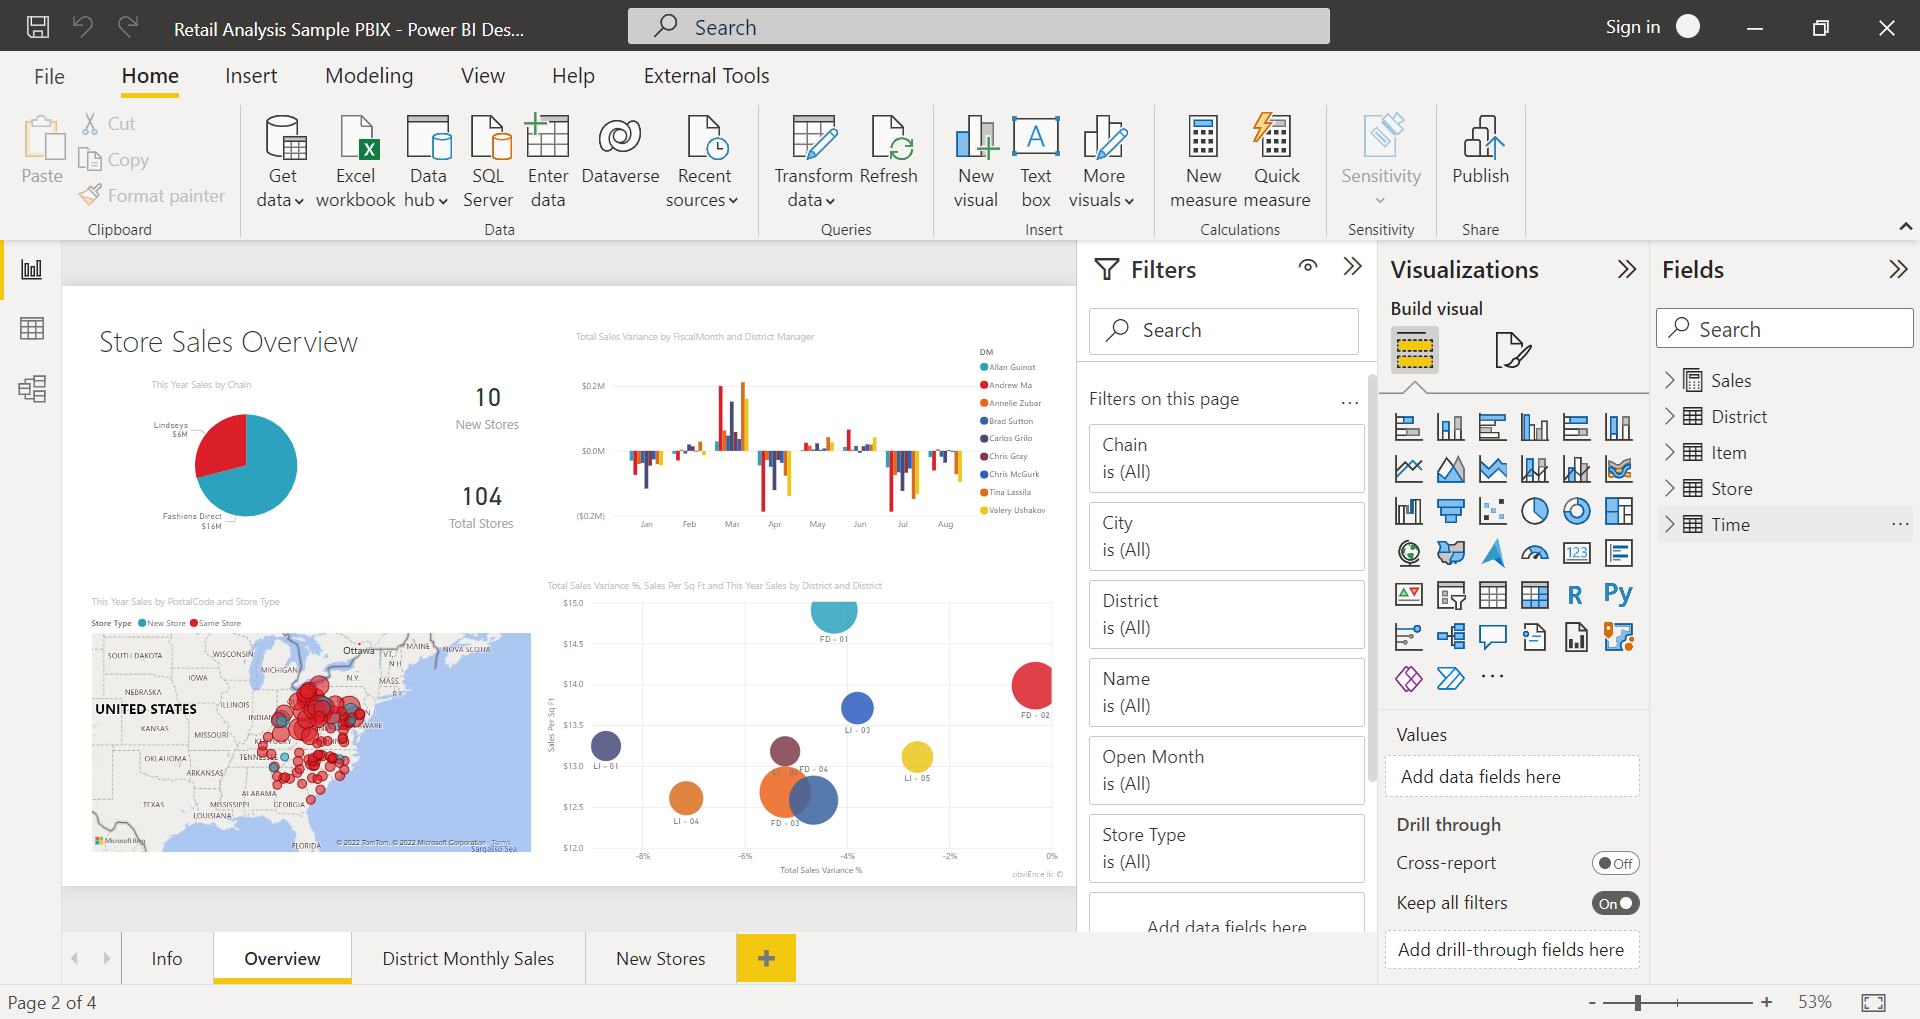
Power BI has a more modern and streamlined user interface that is specifically designed for data analysis and visualization. The drag-and-drop interface in Power BI allows users to create dynamic dashboards and reports quickly and easily.
3. Power BI vs Excel: Data Visualization Options
Data visualization is an essential aspect of analyzing and interpreting data in today's digital age.
Excel
Excel offers a variety of chart types, including bar graphs, line charts, pie charts, and more. Users can easily create these charts by selecting their data and inserting a chart from the toolbar.
Excel also has various customization options such as colors, labels, axes, and other visual elements.
Power BI

Power BI offers a robust set of features compared to Excel, allowing users to create interactive dashboards and reports with drill-down capabilities. If you need advanced analytics features such as real-time reporting, predictive modeling, or integration with multiple data sources, then Power BI would be the better choice.
4. Power BI vs Excel: Learning Curve
Excel
Excel is a widely used spreadsheet program and people are already familiar with it. It offers a wide range of functions and formulas that can be used to analyze and manipulate data. People who are already familiar with Excel may find it easy to use the platform but for new users, the learning curve can be steep because of the various calculations and functionalities.
Power BI
Power BI is more intimidating for beginners due to its complexity, but it can offer robust capabilities for those looking to perform in-depth data analysis. Power BI basics are easy to learn but to perform complex calculations using DAX users may need technical expertise.
5. Power BI vs Excel: Pricing
Excel

Excel is a widely used spreadsheet program that many people already have access to as part of Microsoft Office. The cost of using Excel largely depends on whether you already have a license for Microsoft Office or if you need to purchase it separately.
Power BI
While there is a free version of Power BI available, the full capabilities are only unlocked with a paid subscription. The cost of Power BI varies depending on the plan you choose but typically ranges from $10 to $20 per user per month but this cost can add up quickly if you have multiple users within your organization who need access to the tool.
Also, check out: Tableau Vs Power BI
Also, check out: Looker Vs Power BI
Conclusion
The debate between Power BI and Excel ultimately comes down to your requirements and use cases. Excel is a versatile tool that many of us are already familiar with, Power BI offers advanced data visualization and analysis capabilities that can take your reporting to the next level.
But why choose between the two when you can have the best of both worlds with Sprinkle Data? As a powerful integration and Business Intelligence platform, Sprinkle Data allows you to seamlessly connect your Excel spreadsheets and enable users to perform advanced analytics, giving you access to the strengths of both tools in one cohesive solution.
Frequently Asked Questions FAQs
Is Power BI better than Excel?
Power BI has more advanced features for handling large datasets and performing complex calculations, making it ideal for business intelligence applications. However, Excel is still widely used for basic data analysis and reporting due to its ease of use.
Should I learn Excel first or Power BI?
If you are new to data analysis, it is recommended to start with Excel before moving on to Power BI.
What are the disadvantages of Excel over Power BI?
Some disadvantages of Excel over Power BI are:
- Excel has limitations in handling large datasets and creating interactive visualizations compared to Power BI.
- It can be time-consuming to manually update and format reports in Excel, whereas Power BI automates many of these tasks.
- Collaboration and sharing of reports can be challenging in Excel without using additional tools like SharePoint or OneDrive.
Can Excel be used for Power BI?
Yes, Excel can be used as a source of data in Power BI by importing spreadsheets or connecting directly to an Excel file. Power BI reports can also be exported to Excel for further analysis.
What is the full form of DAX?
DAX stands for Data Analysis Expressions. It is a formula language used in Power BI Desktop for creating custom calculations and aggregations of data.
What are the 3 reasons we use Excel?
The three main reasons are:
- organizing and analyzing data,
- creating charts and graphs for visual representation of information, and
- performing complex calculations using built-in functions and formulas.
Why is Excel so powerful?
Excel's built-in features such as pivot tables, conditional formatting, VLOOKUP function, and macros programming support make it a versatile tool for handling diverse analytical tasks effectively.
Why is Excel difficult to use?
Excel can be difficult to use for beginners due to its steep learning curve associated with understanding complex formulas, functions, and features available within the software.
Is DAX similar to SQL?
DAX is designed specifically for modeling relationships between tables in a relational database environment like Microsoft's Tabular model whereas SQL is a standard language used universally across various database platforms.
Can I use DAX in Excel?
Yes, DAX expressions could be directly employed within MS Excel with having the latest edition installed alongside the necessary plugins.


