

Business Intelligence (BI) tools gather, store, and process large volumes of data from various sources, providing valuable insights into patterns and trends. In this article, we will explore the two famous BI tools Looker and Power BI, and how they can help businesses drive growth and improve operations.
Looker is a powerful business intelligence platform that helps organizations make informed decisions based on their data. It was founded in 2012 and then was acquired by Google Cloud in 2019 and has since become a key player in the business intelligence industry.
Power BI is also a powerful business intelligence tool developed by Microsoft that allows users to visualize and analyze data from various sources. It provides interactive dashboards, reports, and real-time insights that help businesses make informed decisions.
Though both of the BI tools merely serve the same purpose there are some differences between them in terms of user interface, data security, visualization options, collaboration features, etc. In this article, we will delve deeper into each aspect that will help you to choose the right BI tool according to your needs.
1. Looker VS Power BI: Ease of Use
Looker:

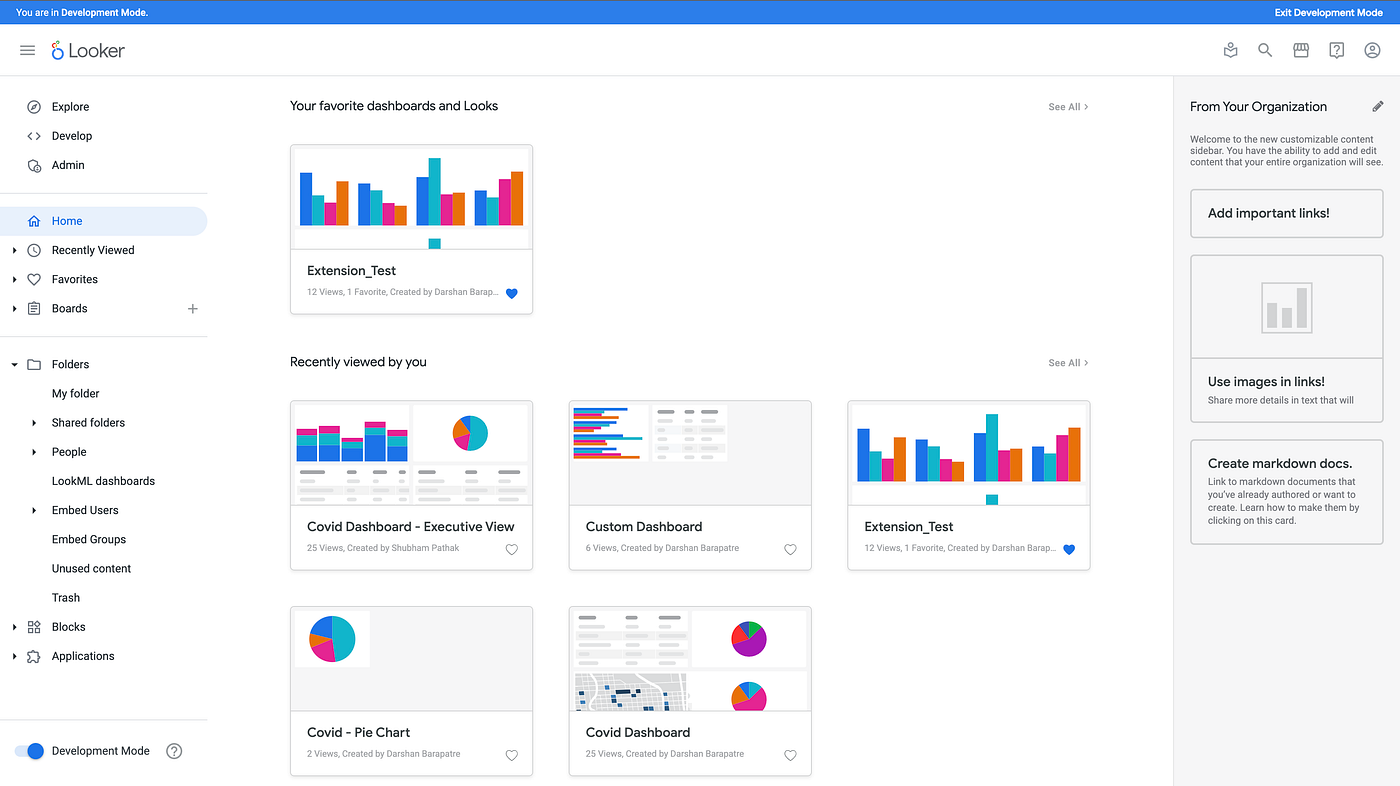
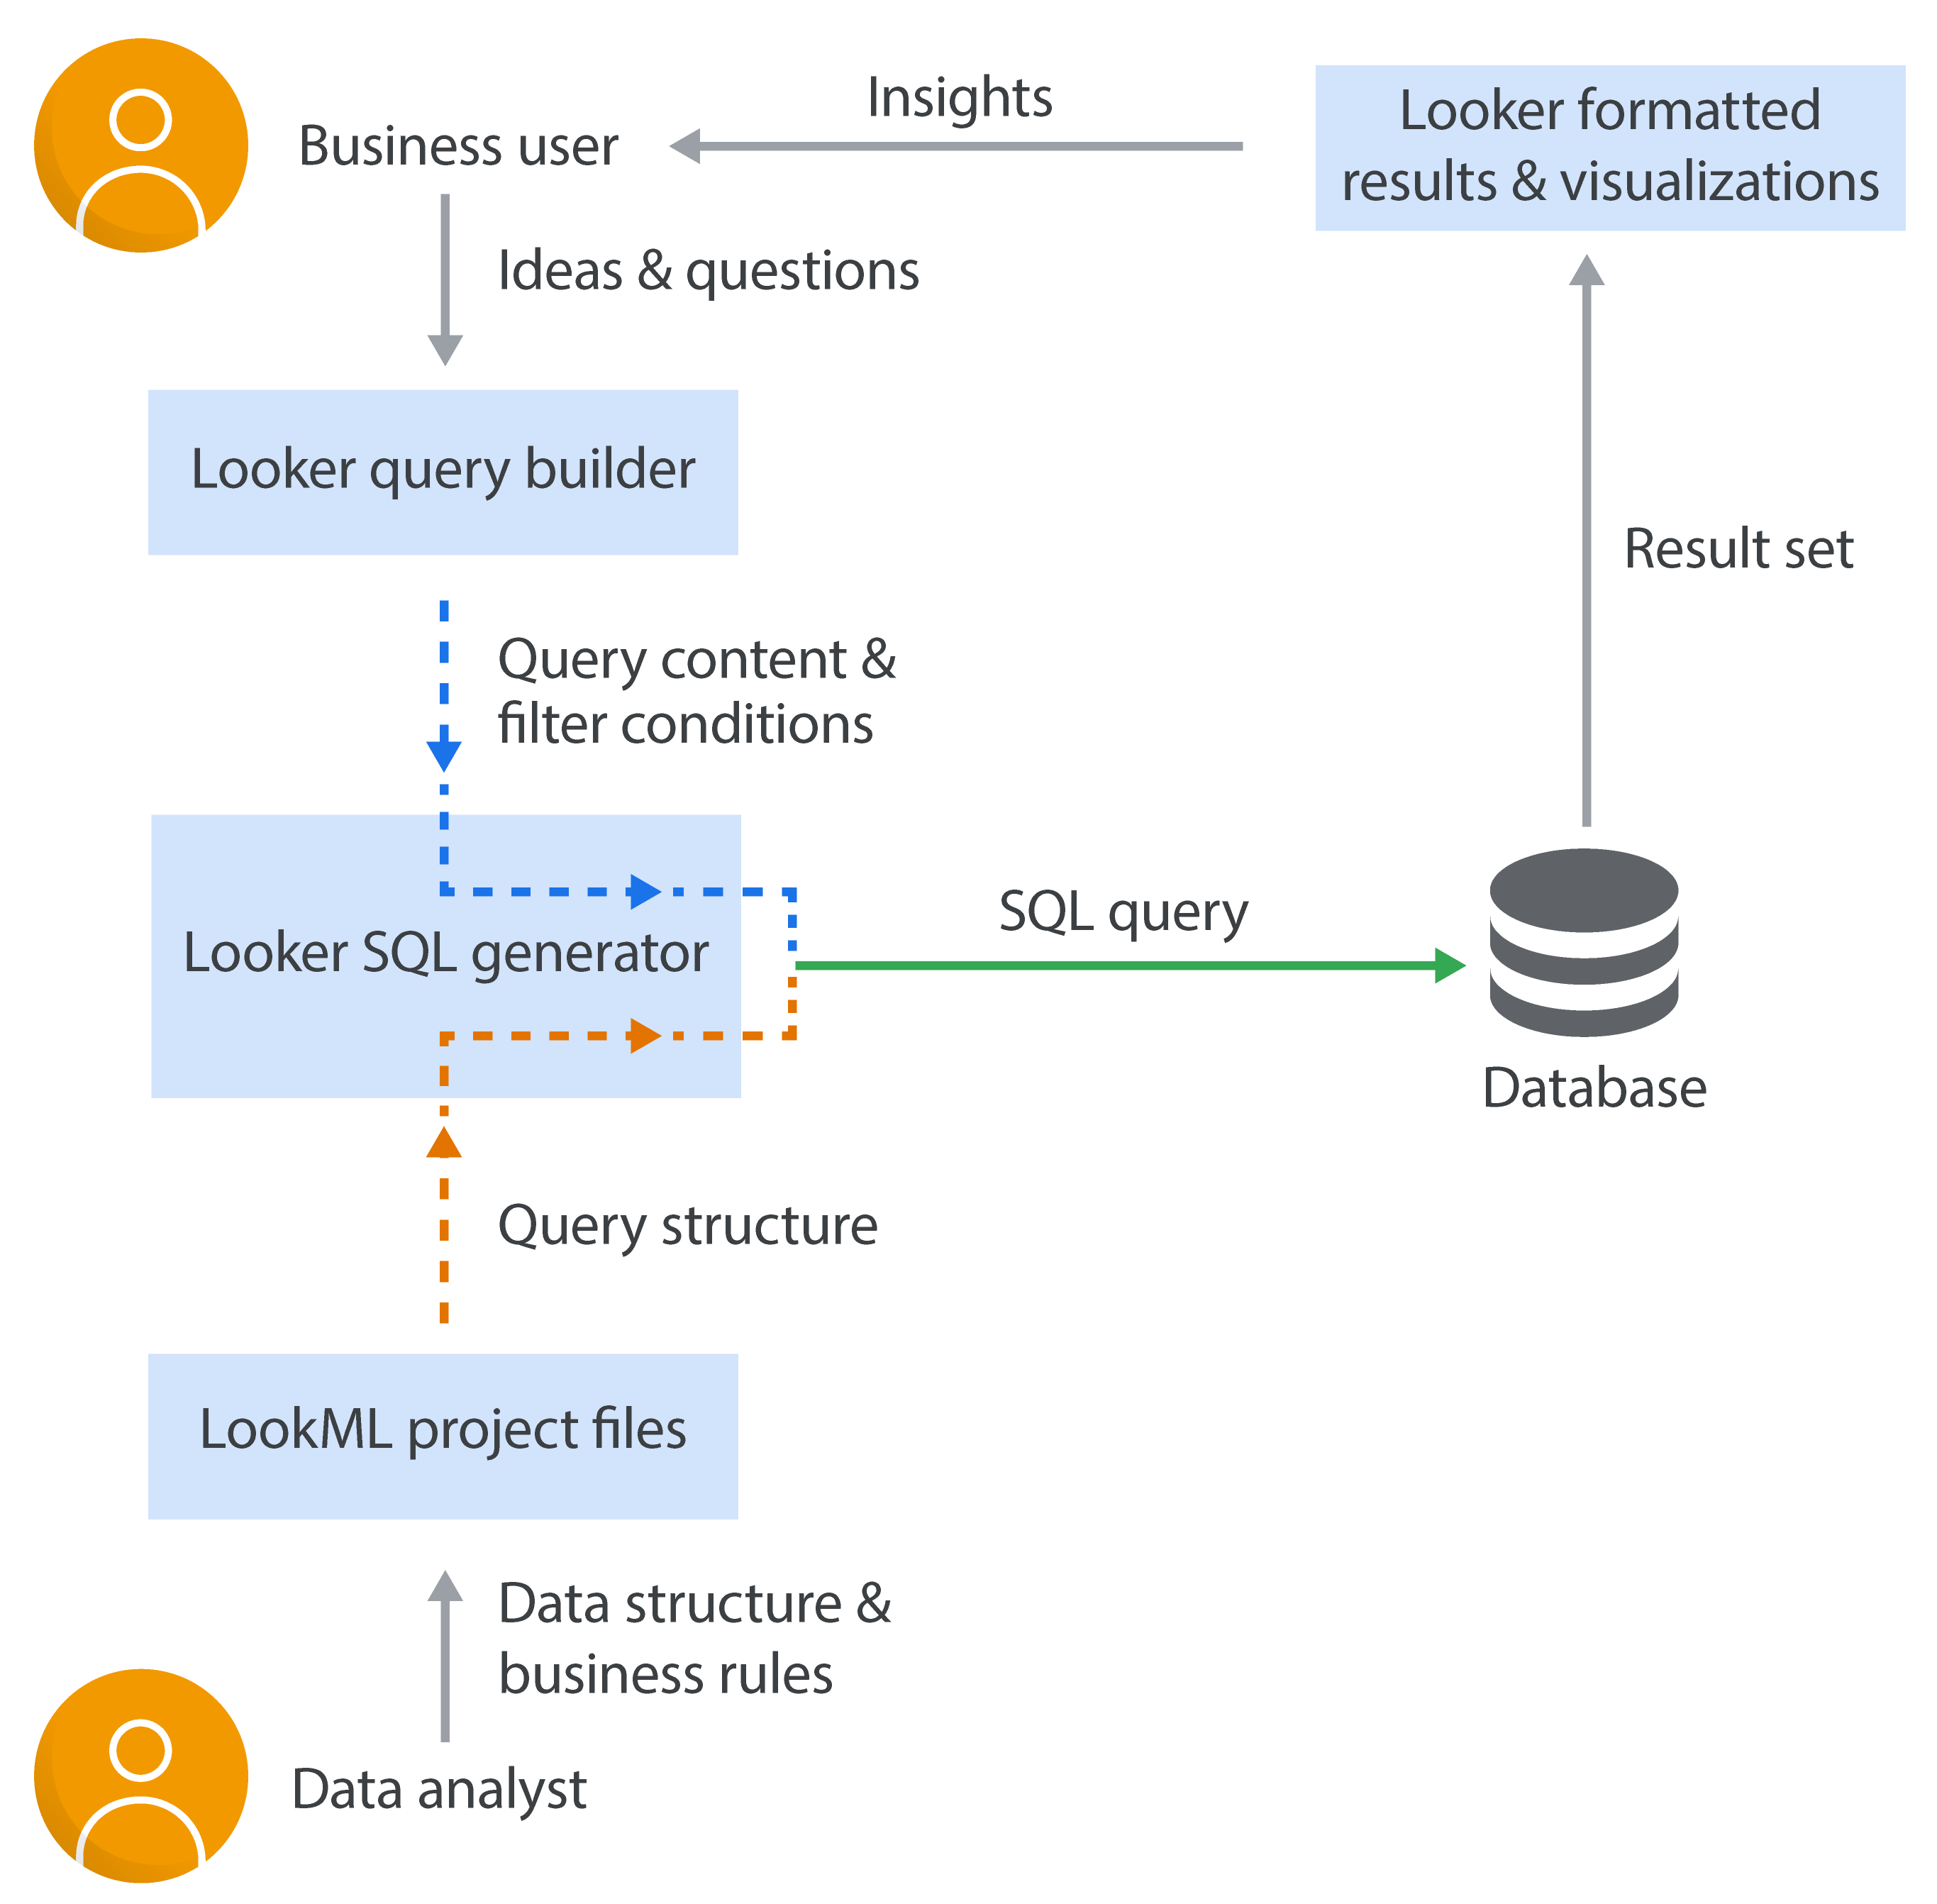
Looker is known for its intuitive and user-friendly interface the platform also uses a unique modeling language called LookML, which simplifies the process of building complex data models and queries. Looker's interface is clean and modern, with drag-and-drop functionality that makes it easy to create visualizations and dashboards.
Power BI

Microsoft Power BI has a more traditional interface that may be familiar to users who have experience with Microsoft products. The platform offers a wide range of pre-built templates and visualizations that can be easily customized to suit individual needs.
Which one to choose?
Looker's sleek design and intuitive navigation make it a great choice for users who prioritize ease of use, while Power BI's familiarity with Microsoft tools may appeal to those who prefer a more traditional interface.
2. Looker VS Power BI: Data Connectivity
Looker

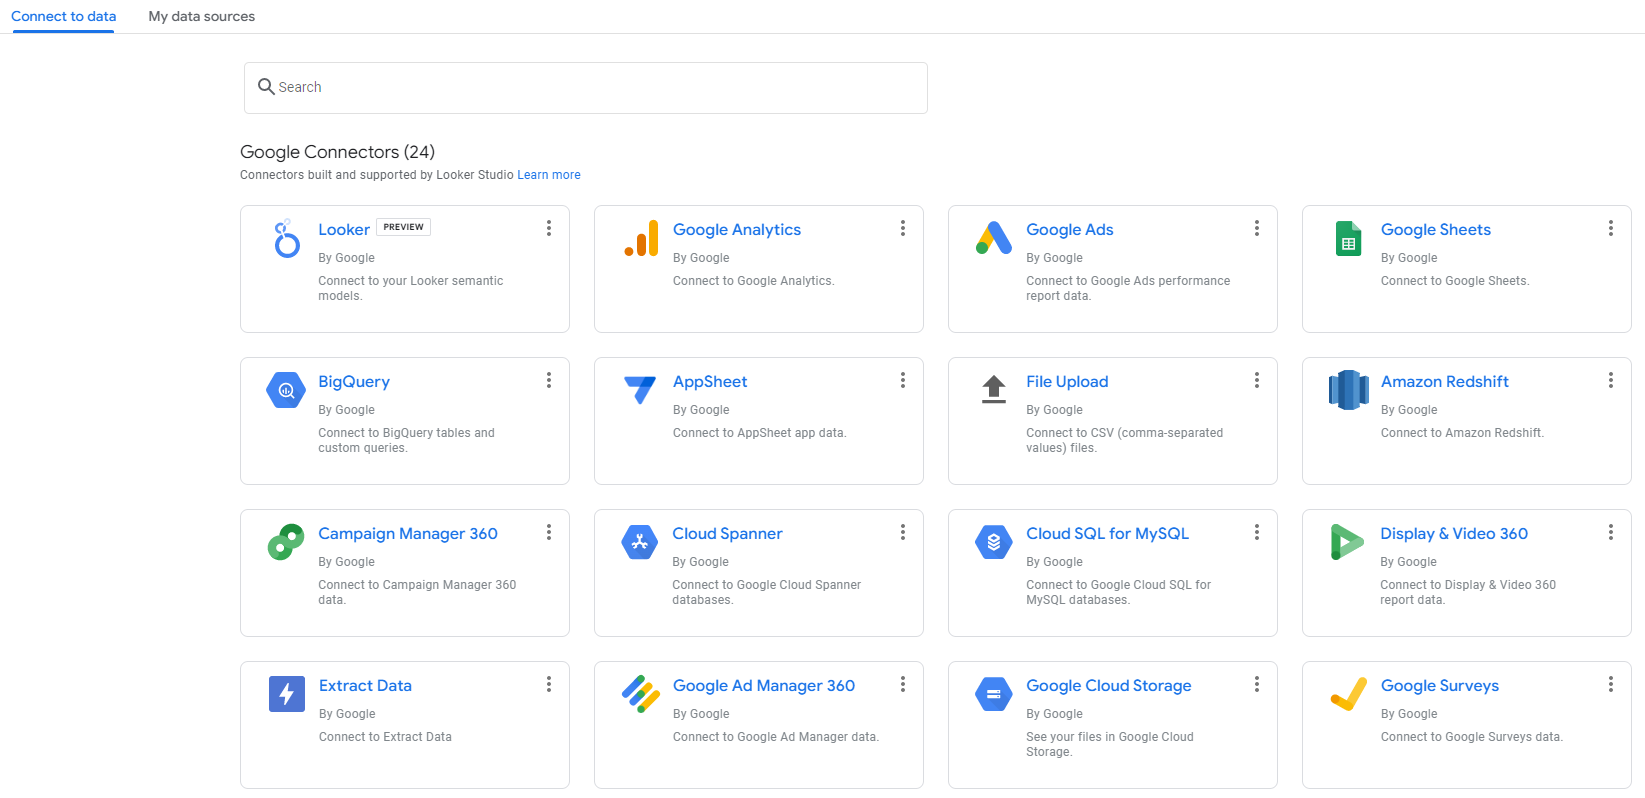
Looker is a cloud-based business intelligence platform that offers seamless connectivity with a wide range of data sources. It natively integrates with popular databases such as
- Amazon Redshift,
- Google BigQuery,
- MySQL,
- PostgreSQL, and more.
Looker also supports connections to third-party applications like Salesforce, Marketo, and Zendesk through APIs or pre-built integrations that allow users to pull in data from multiple sources and create comprehensive reports and dashboards within the platform.
Power BI

Power BI is a Microsoft product that provides similar capabilities for connecting to diverse data sources.
Power BI offers native support for Microsoft products like
- Excel,
- SQL Server,
- Azure SQL Database, and
- Dynamics 365.
It also integrates seamlessly with non-Microsoft platforms such as
- Google Analytics,
- Salesforce,
- MailChimp,
- Facebook, etc
Users can leverage Power BI's robust set of connectors to access data from on-premises databases, cloud services, files, and APIs.
Which one to choose?
If you primarily work with cloud-based databases or need advanced modeling capabilities, Looker might be the better option for you. However, if you are already invested in Microsoft technologies or require a wide range of connectors, Power BI could be the right fit.
3. Looker VS Power BI: Visualization Options
Looker

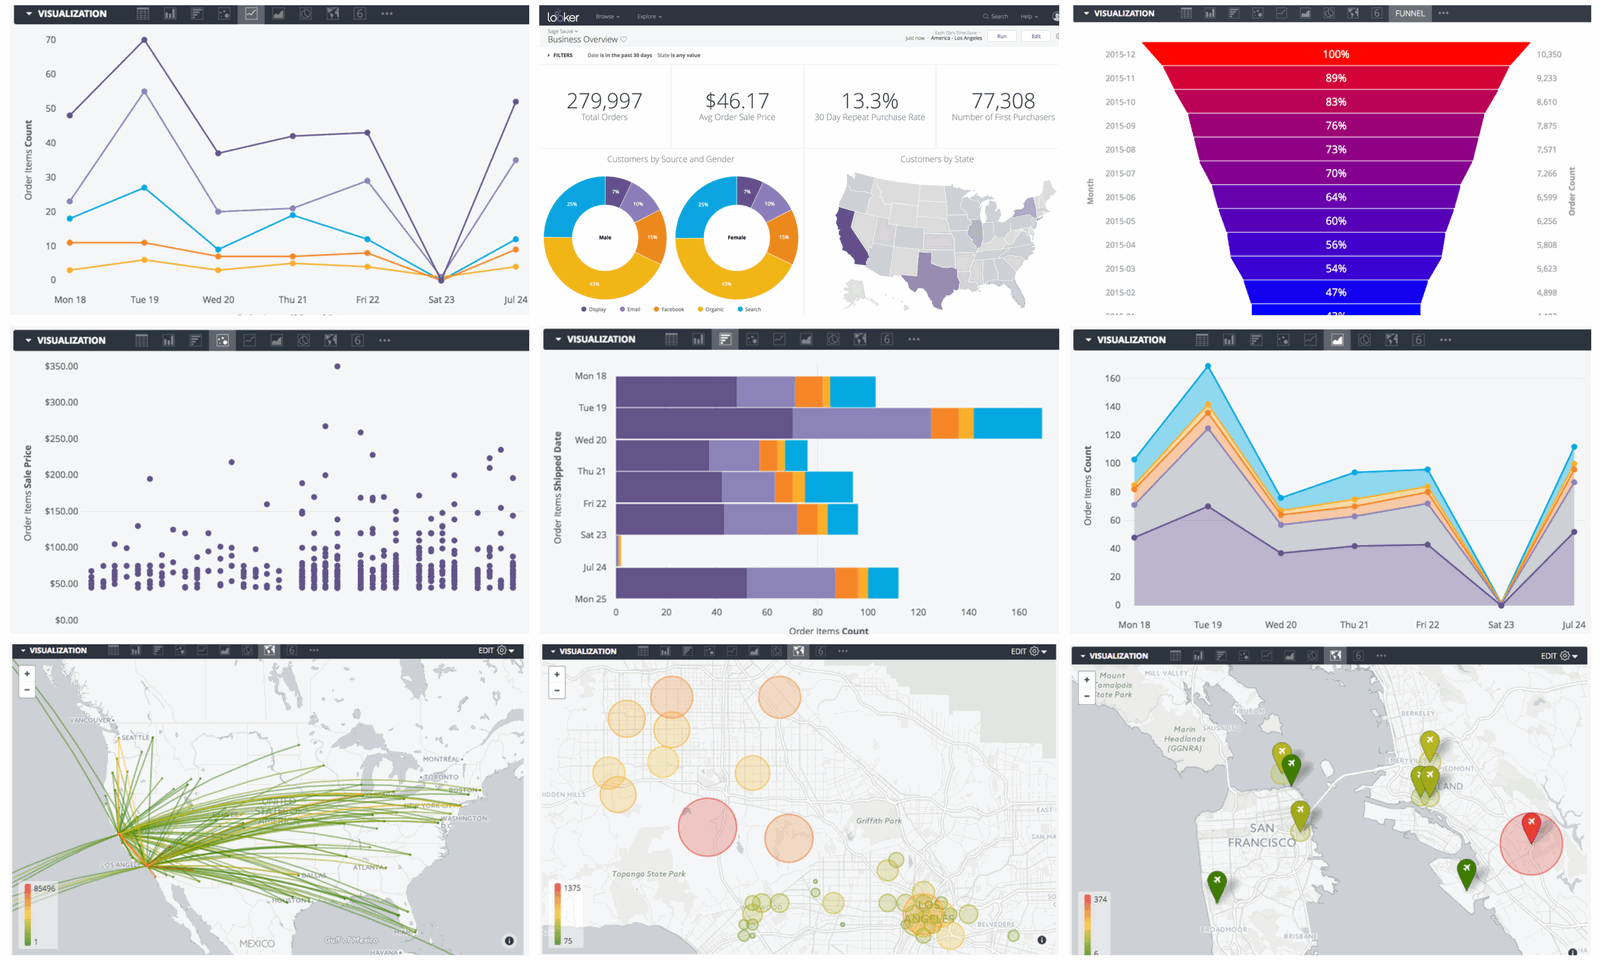
With Looker, users can easily build charts, graphs, and other visualizations to explore and analyze their data. Looker offers a variety of visualization types, including
- bar charts,
- line charts,
- scatter plots,
- heat maps, and more.
Users can also customize colors, labels, axes, and other elements of their visualizations to suit their needs.
Power BI

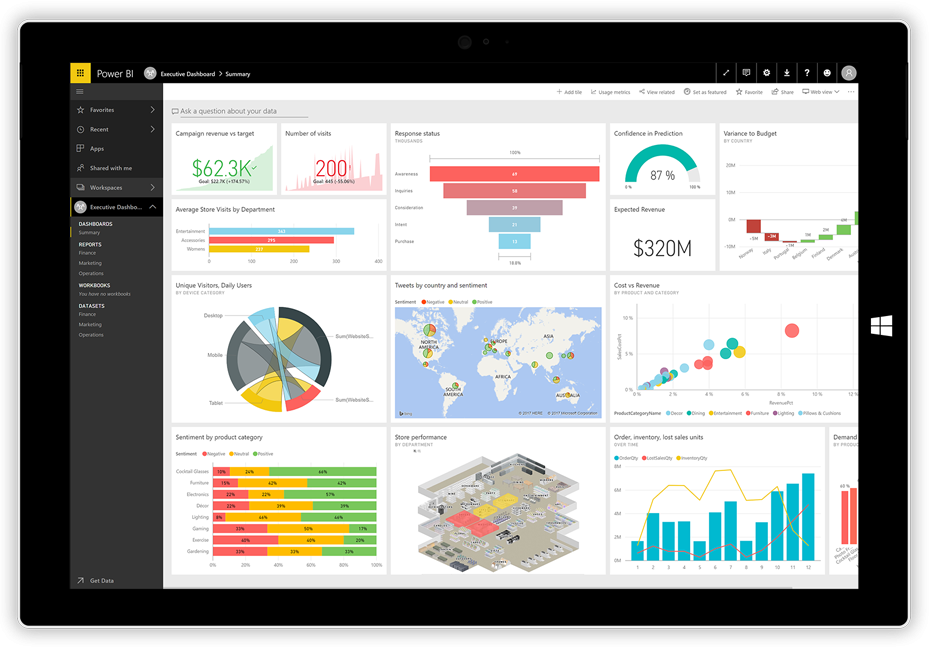
Power BI offers advanced visualization capabilities for creating interactive dashboards. Power BI provides a wide range of visualization options, including
- bar charts,
- pie charts,
- line charts,
- scatter plots,
- maps,
- gauges, and more.
Users can also add interactive elements such as filters, slicers, tooltips, drill-downs, and animations to enhance the interactivity of their dashboards.
Which one to Choose?
Looker's visualization tools are relatively easy to use and require minimal coding skills to create custom visualizations. Whereas Power BI requires more technical expertise and knowledge of DAX (Data Analysis Expressions) language to create complex visualizations.
4. Looker VS Power BI: Pricing Model
Looker
Looker offers a subscription-based pricing model that is tailored to each individual customer based on their specific needs and usage requirements. The cost of a Looker subscription varies depending on factors such as the number of users, the amount of data being analyzed, and the level of support needed. Looker also offers a free trial period so companies can test out the tool before committing to a subscription.
Power BI

Power BI follows a more straightforward pricing model with three main tiers:
- Power BI Desktop (free),
- Power BI Pro ($9.99 per user per month), and
- Power BI Premium (starting at $4,995 per month).
Power BI Pro includes additional features such as increased storage limits, AI capabilities, and collaboration tools, while Power BI Premium is designed for larger organizations with greater data processing needs.
Which one to Choose?
Looker tends to be more expensive than Power BI due to its customizable pricing structure and advanced features. However, some companies may find that the flexibility and scalability offered by Looker justify the higher price tag.
5. Looker VS Power BI: Data Security
Looker
When it comes to data security, Looker offers robust features such as
- role-based access control: Users can define roles and permissions to control who has access to specific datasets or reports, ensuring that sensitive information is only available to authorized individuals.
- encryption at rest and in transit, and
- audit logging: Looker provides detailed audit logs that track user activity, helping organizations monitor and track any potential security threats.
Power BI
Like Looker, Power BI also offers features such as role-based access control and encryption for securing data.
Which one to Choose?
If your organization requires more advanced security features such as fine-grained access controls and detailed audit logs, Looker may be the better choice.
6. Looker VS Power BI: Performance
Looker
One of the key advantages of Looker is its ability to handle large volumes of data quickly and efficiently. The platform uses in-memory processing technology to optimize query performance and ensure fast response times when visualizing data.
Power BI
While Power BI provides powerful features for creating interactive reports and dashboards, some users have reported slower performance compared to Looker when working with large datasets or complex queries. This can be attributed to Power BI's reliance on local processing power.
Which one to Choose?
In terms of scalability, Looker has a reputation for being able to handle larger datasets more effectively than Power BI due to its cloud-native architecture.
Looker's flexibility in allowing users to customize data models and create reusable components can improve performance by reducing redundant calculations and simplifying complex queries.
7. Looker VS Power BI: Data Transformation Capabilities
Looker

One of the key features of Looker is its ability to transform data using LookML, a modeling language that allows users to define relationships between datasets and create reusable data models. This makes it easy for users to perform complex transformations on their data without needing to write complicated SQL queries.
Looker also offers a wide range of built-in functions for transforming and manipulating data, such as filtering, summarizing, pivoting, and aggregating. Users can also create custom calculations and metrics using LookML to further enhance their analysis.
Power BI

Power BI offers a variety of data transformation options through its Query Editor tool, including merging tables, splitting columns, grouping rows, and applying filters. Users can also use Power Query M formula language to create custom transformations on their data.
Which one to Choose?
Looker is ideal for users who prefer working with SQL queries and have more technical expertise in data modeling, while Power BI is suitable for users who prefer an intuitive interface with drag-and-drop functionality.
8. Looker VS Power BI: Embedding Options
Looker

With Looker, organizations can embed these visualizations directly into their own applications or websites using the Looker Embed SDK. This allows users to seamlessly access and interact with their data without having to navigate away from their existing workflows.
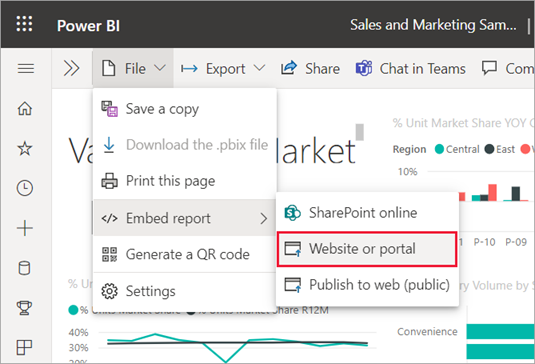
Power BI

Power BI offers several embedding options, including the ability to embed reports and dashboards using an iFrame or JavaScript API. This makes it easy for organizations to integrate Power BI visualizations into their own applications or websites, providing users with real-time access to important data insights.
Which one to Choose?
If you value seamless integration with your existing applications and workflows, Looker may be the better option. On the other hand, if you require a wide range of embedding options and advanced customization capabilities, Power BI may be the right choice for you.
9. Looker VS Power BI: Customer Support
Looker
Looker offers a comprehensive customer support system that includes email support, phone support, live chat, and an extensive knowledge base with documentation and FAQs. Users can also access training resources such as webinars, tutorials, and online courses to enhance their understanding of the platform.
Power BI
Power BI provides a robust customer support system that includes email support, phone support, community forums, and a dedicated user group for sharing tips and best practices. Power BI offers personalized assistance through its premium support service for enterprise customers who require additional help with complex issues.
Which one to Choose?
When comparing Looker vs Power BI customer support, both platforms offer similar levels of assistance to users.
10. Looker VS Power BI: Mobile Accessibility
Looker:
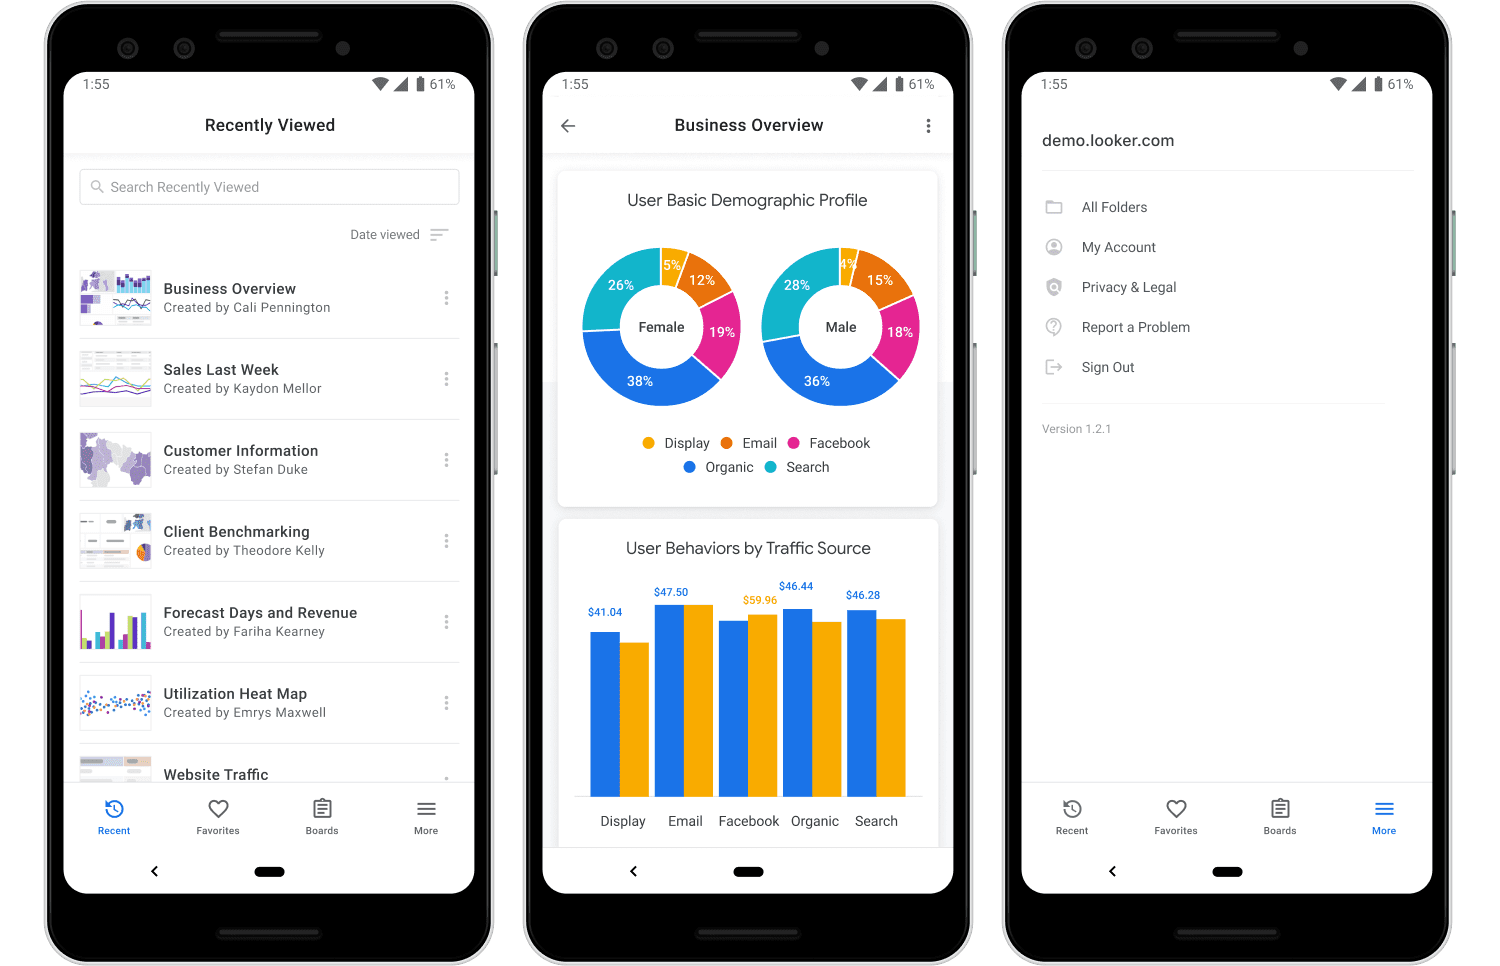
Looker offers a mobile app that is available on both iOS and Android devices, providing users with the ability to access their data anytime, anywhere.
With the Looker mobile app, users can interact with their data by drilling down into specific metrics or filtering data based on different criteria.
Some of the key advantages of Looker's mobile app are:
- its user-friendly interface makes it easy for users to interact with data on smaller screens.
- its offline mode functionality allows users to access their data even when they are not connected to the internet.
Power BI:

Power BI provides a dedicated mobile app for iOS, Android, and Windows devices, allowing users to access their dashboards and reports on the go. However, the Power BI application is not supported in MAC.
Power BI's mobile app offers similar features to its desktop counterpart, including interactive visualizations, drill-down capabilities, and filtering options.
One of the unique features of Power BI's mobile app is
- its integration with other Microsoft products is seamless
Which one to choose?
Both Looker and Power BI offer robust mobile accessibility features that enable users to stay connected to their data while on the go.
Conclusion:
Both Power BI and Looker are widely used data visualization tools, though selecting between them will depend on the particular use case and requirements. Looker is known for its robust modeling capabilities and ability to handle large datasets, while Power BI offers a user-friendly interface and seamless integration with other Microsoft products.
For those looking for a better alternative to Looker and Power BI, Sprinkle Data will be a preferred choice. It is a self-service analytics tool that offers a user-friendly interface, advanced data analytics capabilities, an efficient data modeling layer to define data relationships, and seamless integration with various data sources.
Sprinkle Data also provides customizable data visualizations and reports that can help streamline decision-making processes within your organization. Click here to get started with Sprinkle Data
Frequently Asked Questions FAQs- Looker VS Power BI
What is the Microsoft equivalent of Looker?
The Microsoft equivalent of Looker would be Power BI. Both tools offer similar functionalities in terms of data visualization, analytics, and reporting. However, Looker is known for its advanced data modeling capabilities, while Power BI is praised for its ease of use and integration with other Microsoft products.
Is Looker as good as Tableau?
Looker is often compared to Tableau as both are popular business intelligence tools used for data visualization and analytics. While Tableau may have a more intuitive interface and larger user base, Looker stands out for its robust data modeling capabilities and ability to create custom reports tailored to specific business needs.
What is Looker best for?
Looker is best suited for businesses that require complex data modeling, customization of reports, and real-time insights into their data. It works well for organizations dealing with large volumes of data from multiple sources who need a flexible tool to analyze and visualize their information effectively.
Does Looker require coding?
While Looker does not require coding knowledge to use its basic features, familiarity with SQL can be helpful when working with more advanced functions or customizing reports.
Why is Looker so expensive?
Looker's pricing may seem expensive compared to some other business intelligence tools because it offers advanced features like customizable reports, predictive analytics, embedded analytics solutions, and scalable cloud infrastructure.
Is Looker better than Data Studio?
Data Studio is a basic data visualization tool whereas Looker offers more advanced features like interactive dashboards, drill-down analysis, machine learning integrations, and real-time data processing.
What is Google Looker used with?
Google Looker is typically used alongside other Google Cloud Platform services such as BigQuery for storing large datasets or Dataflow for streamlining data processing workflows. By combining these tools, users can build end-to-end analytics pipelines that deliver actionable insights from raw data efficiently.
Why do data scientists choose Looker?
Data scientists often choose Looker because of its powerful data modeling capabilities that allow them to explore complex datasets easily and derive meaningful insights quickly. With features like version control through LookML language and customizable visualizations, Looker enables data scientists to collaborate effectively across different projects.
Is Looker more expensive than Tableau?
In general, Looker tends to be more expensive than Tableau due to its advanced features like custom report-building capabilities using the proprietary LookML language.


